Agent activity
Checking for WebMCP support
Requests are only sent after you confirm them. How this works
Industry
Video analytics for stations, platforms and concourses
In short
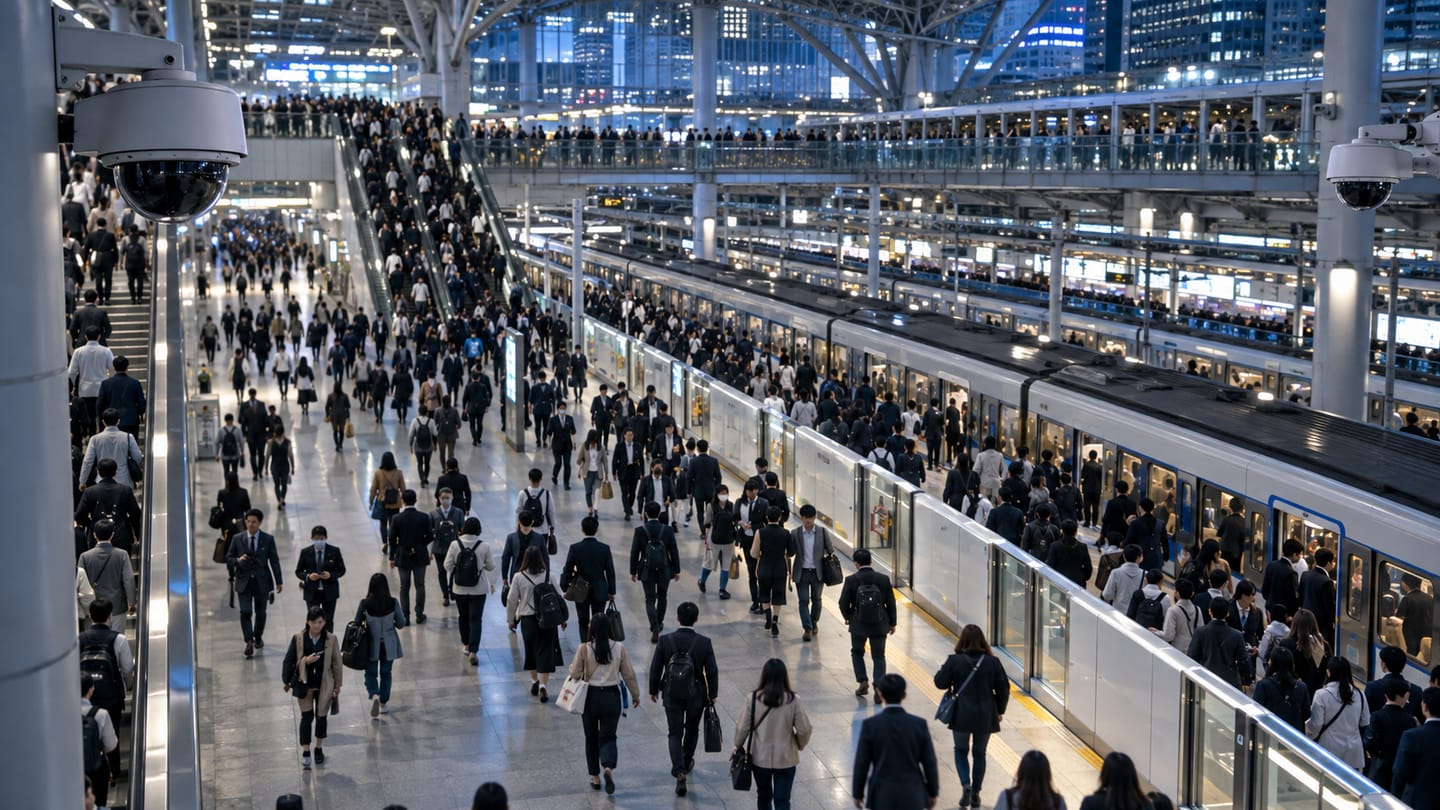
Railway and metro video analytics gives control rooms a consistent, early signal about platform and concourse crowding, station footfall and restricted-area events. Density is reported as calibrated bands rather than counts, because individuals cannot be counted reliably in a dense crowd.
The problem
What railway and metro teams are dealing with
- Platform crowding is judged by eye from the control room and the judgement varies with who is on shift.
- When two lines are disrupted at once, congestion builds faster than anyone can assess across dozens of cameras.
- Station footfall data comes from ticket gates, which miss interchange movement entirely.
- Track-side and equipment-room access is recorded but never surfaced as an event.
- Post-incident review has no objective record of how crowded an area actually was.
Recommended
Analytics that address these problems
Only capabilities Ayonix publishes appear here. Each links to its full scope, camera requirements and limitations.
- Solution-design configuration
Crowd density monitoring
Crowd density monitoring estimates how densely people occupy defined regions of a camera view and trends that estimate over time. It gives control-r…
Read the detail → - Published capability
People counting
Ayonix people counting counts movement across a virtual line on an existing camera view and compares directional flow through the day. It produces e…
Read the detail → - Solution-design configuration
Entrance and exit analytics
Entrance and exit analytics reports directional volumes at each doorway of a building or site. Ayonix people counting already counts entry and exit …
Read the detail → - Published capability
Restricted area monitoring
Restricted area monitoring raises an event when a person or vehicle is present inside a zone that should be empty or access-controlled at that time.…
Read the detail → - Solution-design configuration
Line crossing detection
Line crossing detection raises an event when a tracked object crosses a virtual line drawn on the camera view in a configured direction. Ayonix peop…
Read the detail → - Solution-design configuration
Dwell time alerting
Dwell time alerting raises an event when a tracked person or vehicle remains inside a defined area for longer than a configured threshold. Ayonix dw…
Read the detail →
Camera placement
Where cameras need to be, and why
Camera position decides more of the outcome than any software setting. These are the placements that matter in this sector.
| Location | Purpose | What matters |
|---|---|---|
| Platform, mid and ends | Density banding by region | Elevated views along the platform; a near-horizontal view compresses depth and over-estimates density at the far end. |
| Stair and escalator approaches | Density and rate of change | These are usually the real constraint points and deserve their own regions rather than being folded into a platform view. |
| Gate line | Directional counting | Overhead or steeply angled placement; gate-line counting complements ticket data by capturing interchange movement. |
| Concourse | Zone density and flow | Cover physically meaningful areas; a region that includes a large empty hall will dilute the density figure. |
| Equipment rooms and track access | Restricted-area events | Schedule-aware rules so authorised maintenance windows do not generate noise. |
Workflow
From event to acknowledged action
Event workflow
- 1 Station camera streams are monitored for availability and blocked views.
- 2 Density is estimated per defined region and smoothed across a configurable window.
- 3 Sustained-band and rate-of-change rules are evaluated against the timetable-aware schedule.
- 4 Restricted-area and crossing rules are evaluated with their own permit schedules.
- 5 Warnings are delivered to the control room with the live view and the region trend.
- 6 Actions and acknowledgements are recorded against the event for post-incident review.
Operator workflow
- 1 Control room receives a density warning naming the region and the duration in band.
- 2 The relevant camera is called up automatically alongside the trend for that region.
- 3 The documented flow-control measure is applied — gate-line throttling, platform announcements or staff deployment.
- 4 The measure and its timing are recorded against the event.
- 5 Density history is retained so post-incident review is based on a record rather than recollection.
Operations
Dashboards, integration and deployment
Dashboard metrics
- Density band by platform and concourse region
- Minutes per day in the upper band by region
- Gate-line and interchange counts by interval
- Restricted-area events inside and outside permit windows
- Warning-to-action time
- Camera availability by station
Integration options
- VMS alarm and custom-event delivery with automatic camera call-up
- Webhook delivery into control-room and timetable systems
- REST retrieval for network-level reporting
- ONVIF and RTSP ingestion from station camera estates
Deployment options
- Edge processing at each station so warnings survive a WAN interruption
- On-premise processing where a station already aggregates cameras locally
- Multi-site management so a network control room sees comparable bands across stations
- Air-gapped deployment where the operational technology network is isolated
Evidence
Deployment pattern
Station control-room pattern
Density regions on platforms, stair approaches and concourse, gate-line counting, and schedule-aware restricted-area rules, delivered into the control room with automatic camera call-up.
Band thresholds are calibrated to your own stations during the pilot. Figures from other networks are not transferable, because platform geometry, timetable density and passenger behaviour differ substantially.
This is an anonymised pattern describing how a deployment of this kind is structured. It is not a named customer reference. No customer names, logos, testimonials or measured results are published on this site, because none have been supplied for publication. More on how evidence is handled .
Governance
Privacy and governance in this sector
- Density and counting outputs are aggregate; no individual is identified by these analytics.
- Station privacy notices and signage should cover the analytics purpose, not only CCTV recording.
- Retention of density series can be long because it holds no imagery; event evidence retention should be short.
- Restricted-area monitoring covering staff areas engages employee monitoring obligations and consultation duties.
- Any behaviour-classification analytics is outside the published Ayonix capability set and is not deployed here.
Frequently asked questions
Why report density bands instead of counting people on the platform?
Because in a dense crowd people occlude each other and counting becomes unreliable exactly when the information matters most. A calibrated band that corresponds to a level your crowd-safety plan already recognises is more useful and more honest than a precise-looking number that cannot be trusted.
Can it predict a crowd incident?
No. It reports current and recent density and how quickly it is changing, which lets documented crowd-management measures start earlier. Prediction of crowd incidents is not claimed and should be treated with suspicion wherever it is offered.
How does gate-line counting compare with ticket data?
They measure different things. Ticket data is authoritative for revenue and entry; camera counting at the gate line and interchange routes captures movement that never touches a gate. Most operators find they answer different questions rather than competing.
Other industries
- Author
- Gabriel Bamola, Chief Marketing Officer, Ayonix
- Technical review
- Dr Sadi Vural, Founder and Chief Executive Officer, Ayonix
- Published
- Last reviewed
Design a railway and metro pilot around your own cameras
Start with a camera readiness review and a log-only baseline, then measure against acceptance criteria we agree before the pilot begins. That is what turns an analytics evaluation into a decision.