Agent activity
Checking for WebMCP support
Requests are only sent after you confirm them. How this works
operations analytics
Occupancy analytics for space utilisation decisions
In short
Occupancy analytics reports how intensively a space is used over time, derived from directional counting at its entrances. Where occupancy monitoring raises live threshold alerts, occupancy analytics answers the planning question: how full is this space, how often, and how does that compare with its design capacity.
Scope
What this analytic does, and what it does not
What it detects
- Occupancy level per space sampled across the day
- Peak, median and sustained utilisation per period
- Hours per week a space spends below a utilisation floor
- Utilisation against design capacity per space
What it does not guarantee
- An exact head count at any instant
- Correct figures where a bounding door is not counted
- Identification of who used a space or for what purpose
- A basis for individual performance measurement
The problem
What customers are actually dealing with
These are the situations that lead teams to look at this analytic in the first place.
- Meeting rooms are booked and unused, and the booking system cannot tell the difference.
- A property team is asked to justify floor space with no measured utilisation data.
- Cleaning and HVAC run to a fixed schedule regardless of whether a floor was used.
- Hybrid working changed demand patterns and every space decision is now argued from opinion.
How it works
Detection workflow
Every event carries the rule that produced it, so an operator can see why they were alerted.
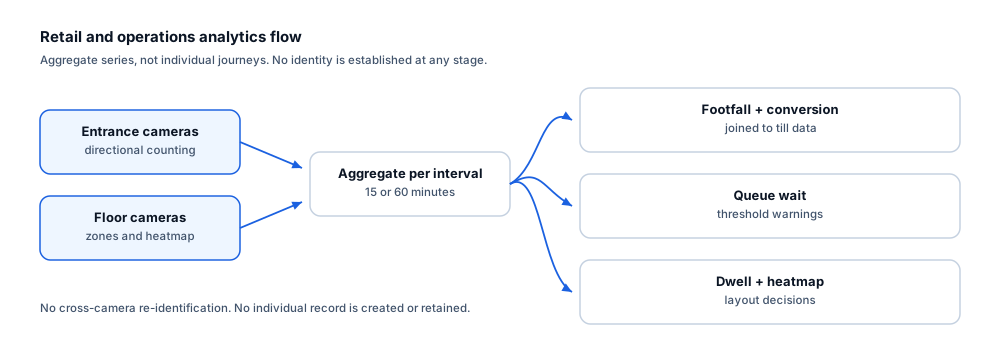
- 1
Count at boundaries
Directional counting at every door bounding each space produces entry and exit events.
- 2
Derive occupancy
A running occupancy figure is maintained per space and sampled at a fixed interval.
- 3
Re-baseline
Scheduled resets at known-empty times limit accumulated drift.
- 4
Aggregate
Samples are aggregated into utilisation statistics per space per period.
- 5
Publish
Utilisation series and capacity comparison are written to the dashboard and exported for planning.
Configuration options
- Space definitions with their bounding doorways and design capacity
- Sampling interval for the utilisation series
- Scheduled reset times per space
- Working-hours schedule so out-of-hours samples are excluded or reported separately
- Utilisation floor and target bands per space type
- Grouping of spaces into floors, buildings and portfolios
Alert quality
How irrelevant and duplicate alerts are reduced
No video analytic eliminates false alerts. These are the mechanisms that reduce them, and the residual rate is measured on your own cameras.
- Scheduled resets at reliably empty times are the primary control on drift in a derived occupancy figure.
- Sampling and aggregating over weeks removes single-day anomalies that would mislead a space decision.
- Reporting utilisation bands rather than instantaneous counts reflects the accuracy the method can actually support.
- Availability is reported alongside utilisation so gaps are visible rather than read as low usage.
- Any uncounted door invalidates the space figure; completeness is checked before a space is reported.
- Even with complete coverage, occupancy remains a derived figure carrying accumulated counting error between resets, and utilisation percentages should be read as bands rather than as exact measurements.
Prerequisites
Camera requirements and environmental limits
Camera suitability decides more of the outcome than any software setting. These are assessed per camera before commitment.
Camera requirements
- A counting-suitable camera at every door bounding each measured space
- Overhead or steeply angled views at each threshold
- Adequate lighting during all hours included in the reporting window
- Stable mounting across the whole measurement period, since a moved camera breaks comparability
- Coverage of the full door width at each boundary
Environmental limitations
- Occupancy is derived from counting and accumulates error between resets.
- Small rooms with a single door are measured far more reliably than large open floors with many access points.
- Utilisation says nothing about the value of the activity taking place in the space.
- Comparisons between spaces are only fair where boundary coverage is equally complete.
Delivery
Alerts, evidence and where they land
Event and evidence fields
- Space name, type and design capacity
- Sample interval and timestamp
- Occupancy at sample
- Utilisation against capacity
- Time since last reset
- Boundary coverage completeness
VMS integration
Utilisation is a planning output rather than an operator alarm and is consumed on dashboards and in property reporting tools. Where the same space also needs live capacity alerting, occupancy monitoring provides those events.
See compatibility states →Deployment options
- Edge processing per building so only aggregate utilisation leaves the site
- On-premise processing where doorway cameras already aggregate locally
- Multi-site deployment for portfolio-level comparison across buildings
Measurement
Dashboard metrics and pilot acceptance criteria
Acceptance thresholds are agreed with you before the pilot starts. This site publishes no benchmark figures, because they do not transfer between sites.
Dashboard metrics
- Utilisation percentage per space per interval
- Peak and median occupancy per space per week
- Hours below the utilisation floor
- Booked-versus-occupied comparison where booking data is joined
- Floor and building rollups
- Boundary camera availability per space
Measurable pilot criteria
- Occupancy drift measured between known-empty resets across a full working day
- Counting error per bounding door against a manual count
- Utilisation stability across two comparable weeks
- Documented boundary completeness for every reported space
- Agreement with an independent spot audit at sampled times
Governance
Privacy and governance
- Utilisation is an aggregate measure of a space, not of the people in it.
- No identity is established and the data must not be used to monitor individual employees.
- Where spaces are staff areas, consultation and employee monitoring obligations commonly apply and should be addressed before deployment.
- Aggregate series can be retained for property planning without retaining imagery.
Frequently asked questions
How is this different from occupancy monitoring?
Both derive occupancy from doorway counting. Occupancy monitoring is a live control that alerts when a space approaches a limit. Occupancy analytics is a planning output that reports how intensively spaces are used over weeks and months.
Can we use it to check whether individuals are at their desks?
No, and it should not be used that way. The output is an aggregate space measure with no identity attached. Using workplace analytics for individual monitoring raises significant legal and employee-relations issues and is outside the intended purpose.
Is it better than a desk sensor?
It answers a different question. Desk sensors measure a specific position; doorway-derived occupancy measures a whole space with fewer devices, using cameras that often already exist. Many estates use both, at different granularities.
Keep reading
Related solutions and industries
Related solutions
-
Occupancy monitoring
Track how many people are inside a space using directional counting at entrances, with configura…
-
Entrance and exit analytics
Report directional entry and exit volumes per doorway, compare peak periods and identify which e…
-
People counting
Count directional footfall across a virtual line using existing cameras, compare peak periods an…
-
Heatmap analytics
Visualise which areas of a floor attract the most activity, compare periods and test layout chan…
Where it is used
-
Corporate buildings
Video analytics for workplace utilisation and building security
-
Education
Video analytics for education estates and campus security
-
Healthcare
Video analytics for healthcare estates and public areas
-
Hospitality
Video analytics for hotel and venue public areas
- Author
- Gabriel Bamola, Chief Marketing Officer, Ayonix
- Technical review
- Dr Sadi Vural, Founder and Chief Executive Officer, Ayonix
- Published
- Last reviewed
Evaluate occupancy analytics on your own cameras
A controlled pilot establishes what this analytic actually does in your environment, against acceptance criteria we agree before it starts. Send a sample video first if you would rather see an assessment before committing to a pilot.