Agent activity
Checking for WebMCP support
Requests are only sent after you confirm them. How this works
traffic analytics
Vehicle counting by direction, lane and interval
In short
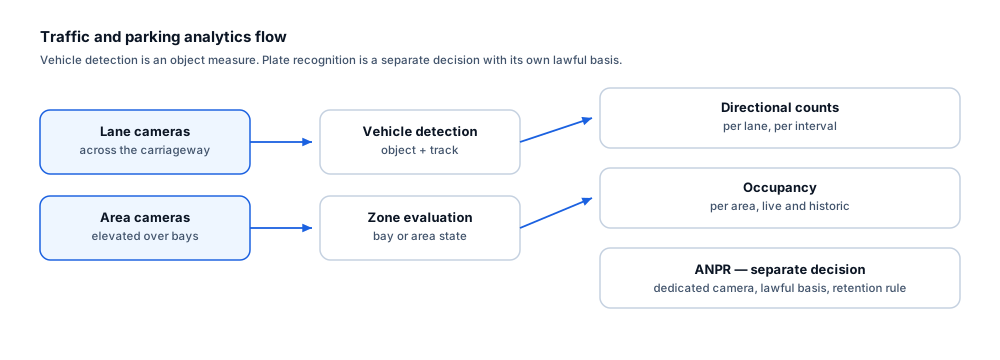
Vehicle counting applies directional line crossing to tracked vehicles, producing counts by direction and interval at entrances, lanes and access roads. It uses cameras you already have, avoiding the civil works involved in inductive loops, and reports aggregate throughput without reading plates.

Scope
What this analytic does, and what it does not
What it detects
- Vehicles crossing a counting line in each direction
- Throughput per interval per lane or entrance
- Peak periods across a day or week
- Directional imbalance between inbound and outbound movement
What it does not guarantee
- Exact counts in stop-start congestion where vehicles queue across the line
- Reliable separation of closely spaced vehicles in a single lane at low frame rates
- Vehicle identity or classification beyond broad class
- Equivalence with a calibrated traffic survey instrument
The problem
What customers are actually dealing with
These are the situations that lead teams to look at this analytic in the first place.
- Access-road volumes are unknown because installing loops means closing the road.
- Barrier counts exclude everything that does not pass the barrier, including exits through a separate gate.
- Traffic surveys are commissioned for a week every few years and are out of date almost immediately.
- Site traffic assumptions in a planning submission cannot be evidenced.
How it works
Detection workflow
Every event carries the rule that produced it, so an operator can see why they were alerted.
- 1
Ingest
Lane or access-road cameras are read and monitored for availability.
- 2
Detect and track
Vehicles are detected and tracked so each produces one continuous path.
- 3
Evaluate crossing
Each track is tested against the counting line and assigned a direction.
- 4
Aggregate
Crossings accumulate into configurable reporting intervals per lane and direction.
- 5
Publish
Interval counts are written to the dashboard and made available for export.
Configuration options
- Counting line position and geometry per lane or carriageway
- Direction labelling consistent across all counted locations
- Reporting interval, commonly fifteen or sixty minutes
- Region masks to exclude adjacent carriageways or parking not in scope
- Minimum track length before a crossing is valid
- Optional broad class split where the view supports it
Alert quality
How irrelevant and duplicate alerts are reduced
No video analytic eliminates false alerts. These are the mechanisms that reduce them, and the residual rate is measured on your own cameras.
- Track-based counting prevents a single vehicle being counted repeatedly as it crosses the line region.
- A minimum track length before the line excludes objects that first appear on the line itself.
- Region masking prevents traffic on an adjacent road from contributing to the count.
- Reporting availability alongside counts prevents stream gaps being read as genuinely quiet periods.
- Congestion across the line remains the dominant error source and is quantified during the pilot.
Prerequisites
Camera requirements and environmental limits
Camera suitability decides more of the outcome than any software setting. These are assessed per camera before commitment.
Camera requirements
- A view across the carriageway rather than along it, so vehicles separate at the line
- A frame rate of at least 15 fps, higher where vehicle speeds are significant
- Sufficient shutter speed to avoid motion blur across the line at the prevailing speed
- Adequate night illumination or IR, with exposure that tolerates headlights
- Stable mounting, since a shifted line silently changes what is counted
Environmental limitations
- Queued traffic straddling the line is the hardest condition and produces the largest errors.
- Motorcycles and cycles may be under-counted depending on view and thresholds.
- Very high speeds at low frame rates can produce missed crossings.
- Counts are aggregate throughput measurements, not a substitute for a calibrated survey instrument where a regulator requires one.
Delivery
Alerts, evidence and where they land
Event and evidence fields
- Lane or line name and direction
- Interval start and end with timezone
- Count in the interval
- Broad class split where configured
- Camera availability percentage
- Site identifier
VMS integration
Vehicle counts are a data series consumed on operational dashboards rather than VMS alarms. Where the same line also requires an out-of-hours crossing alert, a line crossing rule delivers that event separately.
See compatibility states →Deployment options
- Edge processing at the access point so only counts traverse the network
- On-premise processing where road cameras already aggregate locally
- Multi-site deployment for comparable measurement across estates or campuses
Measurement
Dashboard metrics and pilot acceptance criteria
Acceptance thresholds are agreed with you before the pilot starts. This site publishes no benchmark figures, because they do not transfer between sites.
Dashboard metrics
- Vehicle counts per direction per interval
- Daily and weekly throughput trend
- Peak hour per direction
- Inbound versus outbound balance over the day
- Broad class split where configured
- Counting availability per lane
Measurable pilot criteria
- Count accuracy against a manual count at free-flow and congested periods
- Direction accuracy measured separately from total accuracy
- Night performance measured explicitly, including headlight conditions
- Behaviour under a scripted queue across the counting line
- Interval completeness across a continuous two-week window
Governance
Privacy and governance
- Counting produces aggregate totals with no plate reading and no vehicle identity.
- Where a camera view includes public road beyond the site, masking limits processing to the area of interest.
- Aggregate count series can be retained without retaining imagery.
Frequently asked questions
Can this replace inductive loops?
For operational throughput measurement it frequently can, and it avoids civil works by using existing cameras. Where a regulator requires a calibrated survey instrument, camera counting supports the picture but does not replace the specified equipment.
What happens when traffic queues over the line?
That is the hardest condition and the main source of error, because stationary vehicles straddle the line and tracks merge. Line position is chosen during design to sit away from habitual queueing points, and performance under queueing is measured explicitly during the pilot.
Does it count motorcycles and cycles?
It can, but they are smaller and faster and need their own threshold testing. If they matter to your figures, they are included as a specific acceptance case rather than assumed to be covered.
Keep reading
Related solutions and industries
Related solutions
-
Vehicle detection
Detect vehicles in parking areas, yards and monitored locations using existing cameras, as the b…
-
Parking occupancy analytics
Report live and historic occupancy for car parks, yards and bays using vehicle detection over ba…
-
Line crossing detection
Raise an event when a person or vehicle crosses a virtual line in a defined direction, using the…
-
ANPR / licence plate recognition
What ANPR requires to work — camera angle, shutter speed, lighting, plate format and retention —…
Where it is used
-
Smart cities
Video analytics for city mobility and public-space management
-
Parking
Video analytics for car parks without a sensor in every bay
-
Warehouses and logistics
Video analytics for distribution centres and logistics yards
-
Critical infrastructure
Video analytics for utilities, substations and regulated sites
- Author
- Gabriel Bamola, Chief Marketing Officer, Ayonix
- Technical review
- Dr Sadi Vural, Founder and Chief Executive Officer, Ayonix
- Published
- Last reviewed
Evaluate vehicle counting on your own cameras
A controlled pilot establishes what this analytic actually does in your environment, against acceptance criteria we agree before it starts. Send a sample video first if you would rather see an assessment before committing to a pilot.