Agent activity
Checking for WebMCP support
Requests are only sent after you confirm them. How this works
Industry
Video analytics for city mobility and public-space management
In short
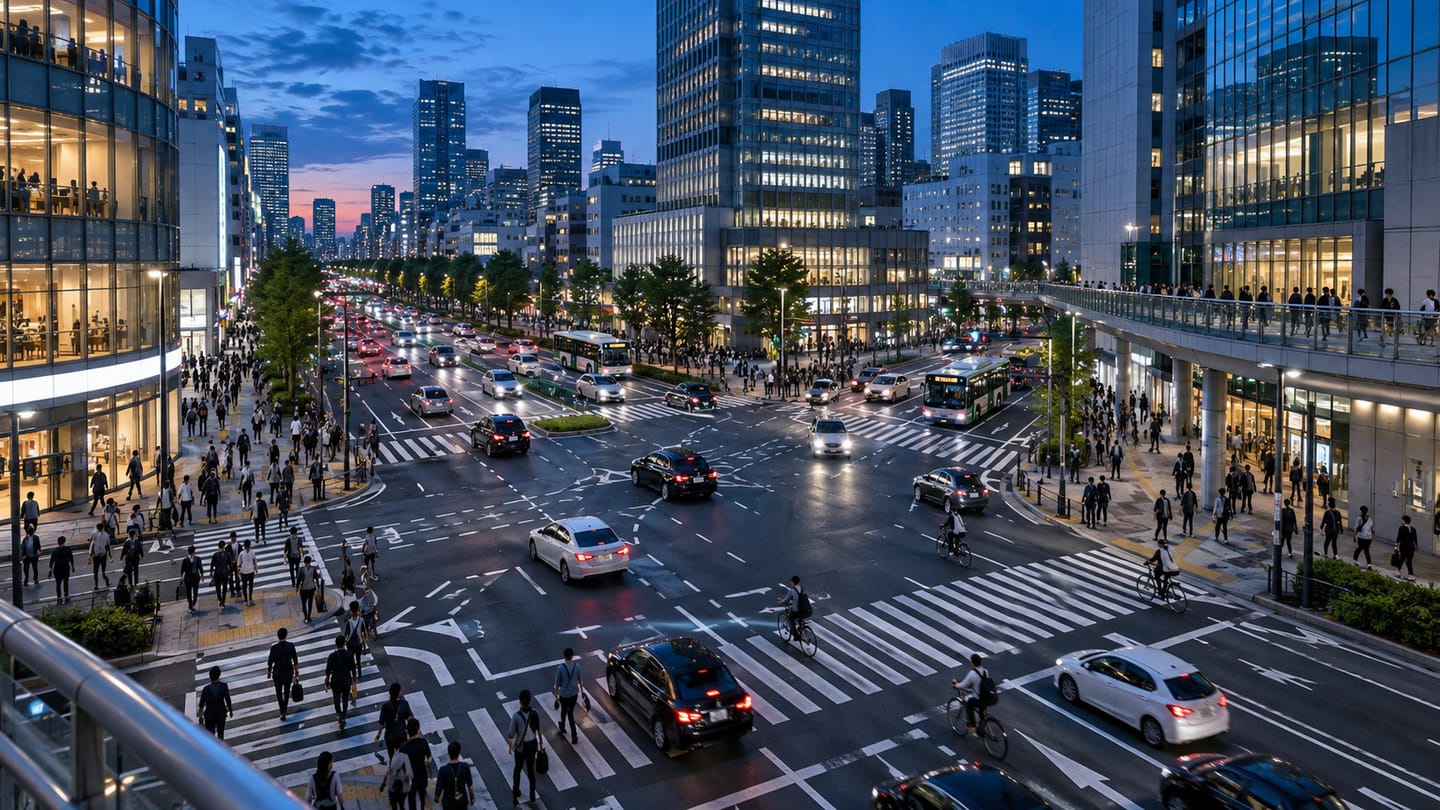
City video analytics converts existing street and junction cameras into aggregate measurements: vehicle volumes by direction, pedestrian counts, parking occupancy and public-space activity. Outputs are aggregate by design, with plate recognition treated as a separate decision requiring its own lawful basis.
The problem
What smart cities teams are dealing with
- Traffic volumes are known only from occasional manual surveys that are out of date almost immediately.
- Installing inductive loops means closing roads and the business case rarely survives the civil works cost.
- Parking occupancy is unknown in real time, so drivers circulate and congestion worsens.
- Active-travel investment must be justified but pedestrian and cycle volumes are not measured.
- Residents and councillors scrutinise camera projects closely and a weak privacy position sinks the scheme.
Recommended
Analytics that address these problems
Only capabilities Ayonix publishes appear here. Each links to its full scope, camera requirements and limitations.
- Solution-design configuration
Vehicle counting
Vehicle counting applies directional line crossing to tracked vehicles, producing counts by direction and interval at entrances, lanes and access ro…
Read the detail → - Published capability
Vehicle detection
Ayonix vehicle detection identifies vehicles in parking areas and monitored locations from an existing camera view, and tracks them between frames. …
Read the detail → - Published capability
People counting
Ayonix people counting counts movement across a virtual line on an existing camera view and compares directional flow through the day. It produces e…
Read the detail → - Solution-design configuration
Parking occupancy analytics
Parking occupancy analytics uses Ayonix vehicle detection over defined bay or area zones to report how full a car park is, live and over time. Becau…
Read the detail → - Solution-design configuration
Crowd density monitoring
Crowd density monitoring estimates how densely people occupy defined regions of a camera view and trends that estimate over time. It gives control-r…
Read the detail → - Published capability
ANPR / licence plate recognition
ANPR reads vehicle licence plates from a camera view and converts them to text for access, parking and logistics workflows. Ayonix lists ANPR among …
Read the detail →
Camera placement
Where cameras need to be, and why
Camera position decides more of the outcome than any software setting. These are the placements that matter in this sector.
| Location | Purpose | What matters |
|---|---|---|
| Junction approaches | Directional vehicle counting | Views across the carriageway rather than along it, positioned away from habitual queueing points. |
| Pedestrian crossings and footways | Pedestrian counting | Elevated placement; active-travel counts need the same view discipline as vehicle counts. |
| Surface car parks | Area occupancy | Height matters more than anything else — a low view cannot see past the front row when the area is full. |
| Public squares and event spaces | Density banding | Cover physically meaningful areas and calibrate bands against the city’s own event-safety thresholds. |
| Controlled access points | Plate recognition where lawfully justified | A dedicated ANPR camera per lane with controlled approach speed; an overview camera will not deliver an acceptable read rate. |
Workflow
From event to acknowledged action
Event workflow
- 1 Street camera streams are ingested and monitored for availability.
- 2 Vehicles and pedestrians are detected, classified and tracked per view.
- 3 Counting lines, occupancy zones and density regions are evaluated per the configured schedule.
- 4 Aggregate series are accumulated per interval; no individual record is created.
- 5 Series are published to city dashboards and open-data pipelines where appropriate.
- 6 Where ANPR is deployed, reads are handled under their own retention and access rules.
Operator workflow
- 1 Traffic team reviews directional volumes by interval against the network model.
- 2 Parking occupancy is published to entrance signage and city apps in near real time.
- 3 Density warnings for event spaces reach the city control room with the live view.
- 4 Active-travel counts are exported into the scheme appraisal evidence base.
- 5 Any ANPR-driven enforcement follows a separate, documented process with its own authorisation.
Operations
Dashboards, integration and deployment
Dashboard metrics
- Vehicle volumes by direction and interval
- Pedestrian and cycle counts by location
- Parking occupancy by area and time
- Public-space density bands during events
- Counting availability by location
- ANPR read rate by lane where deployed
Integration options
- Webhook and REST delivery into city traffic-management platforms
- Open-data export for aggregate mobility series
- VMS alarm delivery for public-space density warnings
- ONVIF and RTSP ingestion from existing city camera estates
Deployment options
- Edge processing at the cabinet or pole so only aggregate counts traverse the city network
- On-premise processing at the city control centre
- Hybrid deployment with local processing and central aggregation
- Air-gapped deployment where the traffic control network is isolated
Evidence
Deployment pattern
Urban mobility pattern
Directional vehicle and pedestrian counting at junctions, area occupancy in car parks, and density banding in public spaces, delivered as aggregate series to city platforms.
Counting accuracy is validated against manual counts on your own junctions during the pilot. Figures from other cities are not transferable because camera geometry, traffic mix and congestion patterns differ.
This is an anonymised pattern describing how a deployment of this kind is structured. It is not a named customer reference. No customer names, logos, testimonials or measured results are published on this site, because none have been supplied for publication. More on how evidence is handled .
Governance
Privacy and governance in this sector
- Counting, occupancy and density outputs are aggregate and contain no identity or individual record.
- Plate recognition is a materially different decision: it processes personal data and requires its own lawful basis, impact assessment, retention rule and access control.
- Public-space camera analytics attract close scrutiny; publishing the analytics purpose, the data produced and the retention rule is usually the difference between a scheme proceeding and stalling.
- Aggregate mobility series can be published as open data because they contain no personal data.
- No behaviour-classification or crowd-prediction analytics is deployed, and claims of either should be treated sceptically.
Frequently asked questions
Can camera counting replace inductive loops?
For operational volume measurement it frequently can, and it avoids road closures by using cameras that often already exist. Where a regulator specifies a calibrated survey instrument, camera counting supports the picture but does not replace the specified equipment.
Does a city analytics scheme require ANPR?
No, and most do not. Volumes, occupancy and density are all aggregate measurements with no plate reading. ANPR is a separate decision with substantially higher privacy obligations and should only be deployed where a specific purpose genuinely requires it.
What can we publish as open data?
Aggregate counts, occupancy percentages and density bands contain no personal data and are commonly published. Plate reads are personal data and must not be published in any form.
Other industries
- Author
- Gabriel Bamola, Chief Marketing Officer, Ayonix
- Technical review
- Dr Sadi Vural, Founder and Chief Executive Officer, Ayonix
- Published
- Last reviewed
Design a smart cities pilot around your own cameras
Start with a camera readiness review and a log-only baseline, then measure against acceptance criteria we agree before the pilot begins. That is what turns an analytics evaluation into a decision.