Agent activity
Checking for WebMCP support
Requests are only sent after you confirm them. How this works
retail analytics
Customer flow analytics that trace the route, not just the total
In short
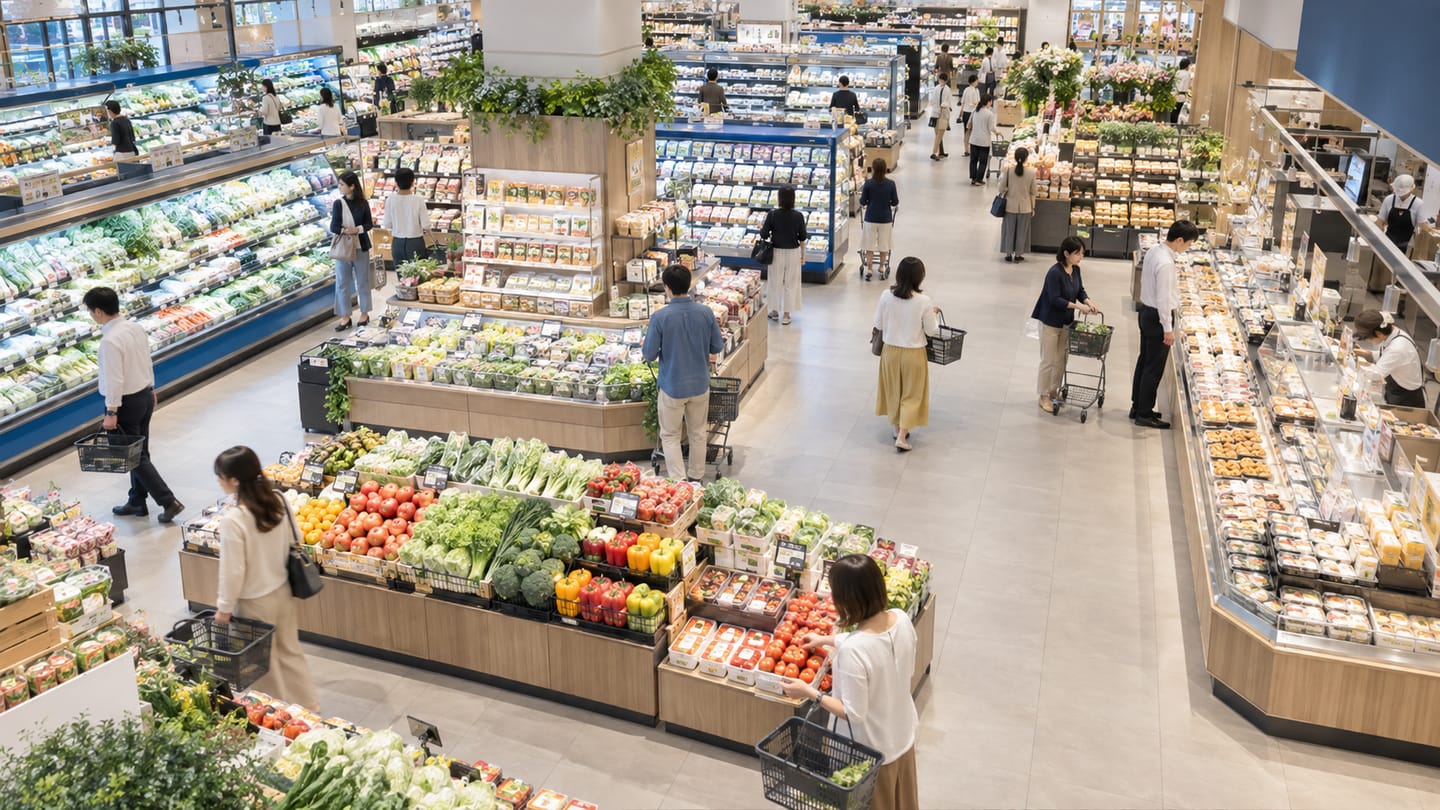
Customer flow analytics combines Ayonix directional counting, dwell measurement and heatmap accumulation to describe how visitors move through a space. It shows which routes carry most traffic, which zones are reached and which are bypassed, as aggregate patterns rather than individual journeys.
Scope
What this analytic does, and what it does not
What it detects
- Directional flow volumes along defined routes
- Relative activity across zones of a floor
- Zone reach — the share of arrivals that reach a given area
- Change in flow pattern between comparable periods
What it does not guarantee
- An individual customer journey from entrance to exit
- Cross-camera tracking of a specific person
- Attribution of sales to a particular route
- Accurate flow where coverage between zones has gaps
The problem
What customers are actually dealing with
These are the situations that lead teams to look at this analytic in the first place.
- A mall knows total footfall but not which routes people take between anchors.
- Upper floors underperform and nobody can show whether the problem is reach or conversion.
- Wayfinding is redesigned without measuring how people actually move now.
- Flow assumptions in the original store design were never tested after opening.
How it works
Detection workflow
Every event carries the rule that produced it, so an operator can see why they were alerted.
- 1
Define the network
Counting lines are placed on the routes between zones, and zones are defined for activity accumulation.
- 2
Measure
Directional counts, dwell and accumulated activity are collected concurrently across the covered area.
- 3
Aggregate
Route volumes and zone reach are computed as aggregate proportions per interval.
- 4
Compare
The current period is compared against a stored baseline to show change.
- 5
Publish
Flow volumes and zone reach are published to the dashboard and exported for planning.
Configuration options
- Route counting lines between zones, with consistent direction labelling
- Zone definitions aligned to commercially meaningful areas
- Reporting intervals and the baseline period used for comparison
- Exclusions for staff routes and service corridors
- Trading-hours schedule
- Whether reach is expressed against total arrivals or against a specific entrance
Alert quality
How irrelevant and duplicate alerts are reduced
No video analytic eliminates false alerts. These are the mechanisms that reduce them, and the residual rate is measured on your own cameras.
- Consistent direction labelling across all lines is what makes route volumes comparable rather than merely present.
- Aggregation across a multi-week period removes single-day effects such as weather or a one-off event.
- Coverage gaps between zones are documented explicitly so reach figures are not over-interpreted.
- Excluding staff routes prevents back-of-house movement from distorting the flow picture.
- Flow is reported as aggregate proportions, not as reconstructed individual journeys.
- Counting error at each measurement point propagates into every derived proportion, so route volumes remain estimates whose confidence depends on coverage completeness rather than on the reporting period.
Prerequisites
Camera requirements and environmental limits
Camera suitability decides more of the outcome than any software setting. These are assessed per camera before commitment.
Camera requirements
- Counting-suitable views at every route between zones that matters to the analysis
- Elevated views over zones used for activity accumulation
- Enough coverage that a route is not inferred from an unmeasured gap
- Consistent lighting across the covered area and through trading hours
- Stable mounting across all cameras contributing to a comparison baseline
Environmental limitations
- Any unmeasured route weakens every derived proportion, so coverage design matters more than tuning.
- Flow is aggregate; it does not reconstruct where an individual went.
- Comparability across periods requires that no camera was moved or re-aimed in between.
- Very large open spaces may need several cameras to describe a single route.
Delivery
Alerts, evidence and where they land
Event and evidence fields
- Route or line name and direction
- Interval volumes per route
- Zone reach proportion
- Baseline reference for comparison
- Coverage completeness indicator
- Camera availability across contributing cameras
VMS integration
Flow analytics is a planning output consumed on dashboards and in BI tools. It does not generate operator alarms and is not normally surfaced inside the VMS.
See compatibility states →Deployment options
- On-premise processing where a single site has many contributing cameras
- Edge processing per building in a multi-building campus or centre
- Hybrid deployment so estate-level comparison runs centrally on aggregate series only
Measurement
Dashboard metrics and pilot acceptance criteria
Acceptance thresholds are agreed with you before the pilot starts. This site publishes no benchmark figures, because they do not transfer between sites.
Dashboard metrics
- Route volumes by direction and interval
- Zone reach as a share of arrivals
- Flow change against baseline
- Top and bottom routes by volume
- Coverage completeness per analysis
- Contributing camera availability
Measurable pilot criteria
- Route volume accuracy against manual counts at sampled lines and times
- Stability of reach proportions across two comparable weeks
- Documented coverage completeness, with gaps explicitly listed
- Sensitivity check that a deliberate change produces the expected directional shift
- Data completeness across trading hours for all contributing cameras
Governance
Privacy and governance
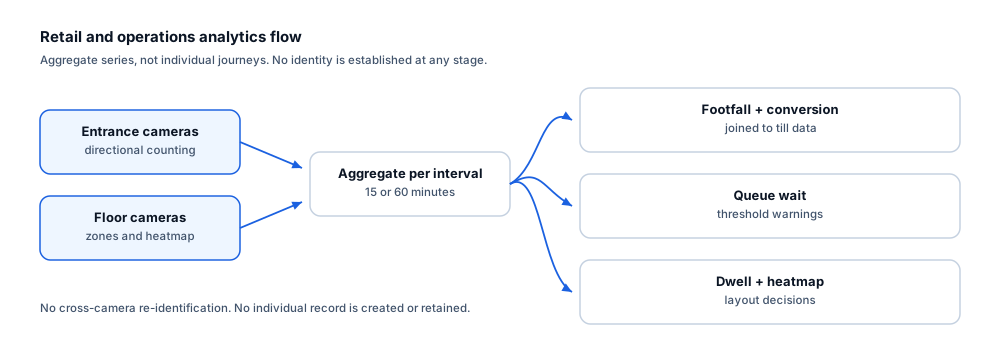
- All outputs are aggregate proportions and volumes; no individual journey is stored or reconstructed.
- No cross-camera re-identification is performed.
- Aggregate series can be retained for planning without retaining imagery.
- Zones covering staff areas should be excluded or handled under employee monitoring obligations.
Frequently asked questions
Can you show me one shopper’s path through the centre?
No. This site does not offer cross-camera re-identification. Flow analytics reports aggregate volumes and proportions across routes and zones, which answers layout and reach questions without building individual journeys.
What if some routes have no camera?
Those routes are recorded as coverage gaps and the resulting proportions are qualified accordingly. It is better to state the gap than to infer a volume that was never measured, and the readiness review identifies gaps before the analysis is designed.
How is this different from a heatmap?
A heatmap shows where activity accumulates within one camera view. Flow analytics links measurements across several cameras into route volumes and zone reach, which answers questions about movement between areas rather than within one.
Keep reading
Related solutions and industries
Related solutions
-
Heatmap analytics
Visualise which areas of a floor attract the most activity, compare periods and test layout chan…
-
People counting
Count directional footfall across a virtual line using existing cameras, compare peak periods an…
-
Entrance and exit analytics
Report directional entry and exit volumes per doorway, compare peak periods and identify which e…
-
Dwell time analytics
Measure how long people remain in defined areas such as counters, displays and waiting halls, an…
Where it is used
-
Shopping malls
Video analytics for shopping centre leasing and operations
-
Retail
Video analytics for stores that already have the cameras
-
Airports
Video analytics for airport terminals and airside boundaries
-
Stadiums and events
Video analytics for stadium gates, concourses and event spaces
- Author
- Gabriel Bamola, Chief Marketing Officer, Ayonix
- Technical review
- Dr Sadi Vural, Founder and Chief Executive Officer, Ayonix
- Published
- Last reviewed
Evaluate customer flow analytics on your own cameras
A controlled pilot establishes what this analytic actually does in your environment, against acceptance criteria we agree before it starts. Send a sample video first if you would rather see an assessment before committing to a pilot.