Agent activity
Checking for WebMCP support
Requests are only sent after you confirm them. How this works
Industry
Video analytics for stores that already have the cameras
In short
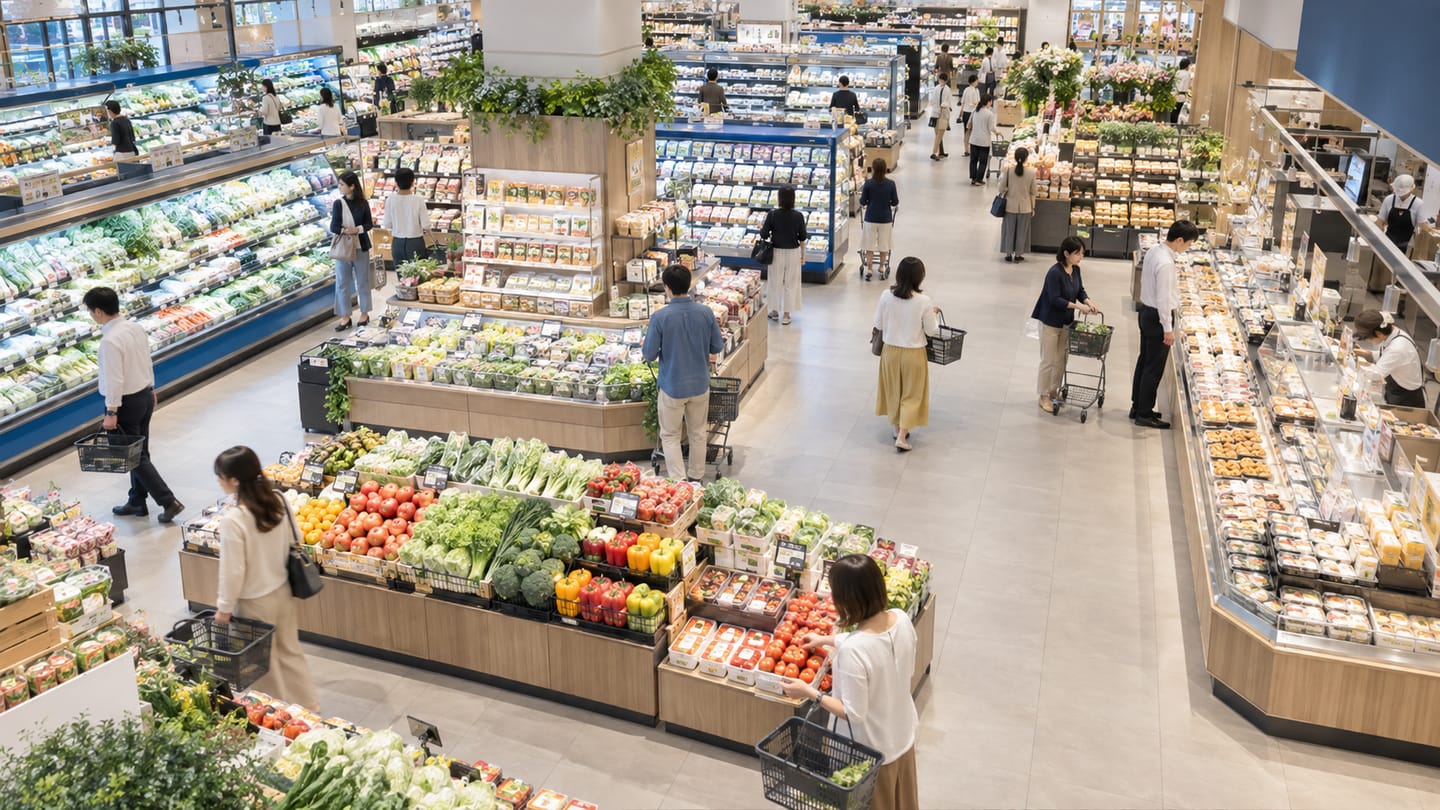
Retail video analytics measures what till data cannot: how many people entered, where they went, how long they stayed and how long they waited. Ayonix publishes people counting, dwell analysis and heatmap analysis as core capabilities, all of which run on an existing store camera estate.
The problem
What retail teams are dealing with
- Sales are known precisely and footfall is not, so conversion cannot be calculated at store or entrance level.
- Queue problems surface as complaints and abandoned baskets rather than as a measurement anyone can act on.
- Merchandising changes are made and their effect on shopper behaviour is never measured, only inferred from sales that moved for other reasons.
- Dedicated counting sensors at every door were quoted and the capital cost killed the project.
- Head office compares stores on sales per square metre without knowing how the floor is actually used.
Recommended
Analytics that address these problems
Only capabilities Ayonix publishes appear here. Each links to its full scope, camera requirements and limitations.
- Published capability
People counting
Ayonix people counting counts movement across a virtual line on an existing camera view and compares directional flow through the day. It produces e…
Read the detail → - Solution-design configuration
Queue management
Queue management applies Ayonix dwell measurement and people counting to a defined queue area. It reports how many people are waiting and how long t…
Read the detail → - Published capability
Dwell time analytics
Ayonix dwell analysis measures how long people remain in defined areas of a camera view. Reported as distributions rather than single averages, dwel…
Read the detail → - Published capability
Heatmap analytics
Ayonix heatmap analysis visualises the areas of a camera view that attract the most activity, accumulated over a chosen period. It shows which aisle…
Read the detail → - Solution-design configuration
Customer flow analytics
Customer flow analytics combines Ayonix directional counting, dwell measurement and heatmap accumulation to describe how visitors move through a spa…
Read the detail → - Solution-design configuration
Entrance and exit analytics
Entrance and exit analytics reports directional volumes at each doorway of a building or site. Ayonix people counting already counts entry and exit …
Read the detail →
Camera placement
Where cameras need to be, and why
Camera position decides more of the outcome than any software setting. These are the placements that matter in this sector.
| Location | Purpose | What matters |
|---|---|---|
| Each public entrance | Directional footfall counting | Overhead or steeply angled at the threshold; a wall-mounted wide view across a busy door will not produce trustworthy counts. |
| Checkout approach | Queue length and wait | One elevated camera covering a lane group usually beats several low cameras, because it sees the queue at full extent. |
| Shop floor, elevated | Heatmap accumulation | The higher and more vertical the view, the less perspective bias in the accumulated map. |
| Promotional displays | Dwell measurement | The subject must stay visible for the whole dwell, not just at the zone edge. |
| Staff doors | Exclusion from customer counts | Counting them separately is what keeps the customer figure clean. |
Workflow
From event to acknowledged action
Event workflow
- 1 Entrance and floor cameras are ingested and monitored for availability.
- 2 People are detected and tracked; counting lines and zones are evaluated per trading-hours schedule.
- 3 Counts, dwell and accumulated activity are aggregated into reporting intervals.
- 4 Queue thresholds are evaluated and warnings raised where the service standard is breached.
- 5 Aggregate series are published to the retail dashboard and exported to BI.
- 6 Where transaction data is joined, conversion is computed per entrance and interval.
Operator workflow
- 1 Duty manager receives a queue warning on a handheld naming the lanes and the measured wait.
- 2 An additional position is opened, or staff are redeployed from the floor.
- 3 The action time is recorded so warning-to-action latency can be reviewed.
- 4 Weekly trading review uses footfall, conversion and queue-breach data rather than recollection.
- 5 Merchandising review compares dwell and heatmap against the pre-change baseline.
Operations
Dashboards, integration and deployment
Dashboard metrics
- Footfall by entrance and interval
- Conversion where transaction data is joined
- Median and 90th-percentile checkout wait
- Dwell by display zone
- Floor activity map and low-intensity area share
- Counting availability per entrance
Integration options
- REST and webhook delivery into retail BI and workforce-management tools
- Transaction-data join for conversion reporting
- VMS event delivery where loss-prevention rules are also deployed
- ONVIF and RTSP ingestion from the existing store estate
Deployment options
- Edge processing per store so only aggregate series leave the site
- On-premise processing where a large store aggregates cameras locally
- Hybrid deployment with local processing and central estate reporting
- Multi-site management so counting lines and direction labelling stay consistent across the estate
Evidence
Deployment pattern
Store trading pattern
Entrance counting, checkout queue measurement, display dwell and a shop-floor heatmap, delivered to a retail dashboard with conversion where transaction data is joined.
Improvements are measured against your own pre-change baseline during the pilot. Ayonix publishes no uplift figures from other retailers, because store format, catchment and trading patterns do not transfer.
This is an anonymised pattern describing how a deployment of this kind is structured. It is not a named customer reference. No customer names, logos, testimonials or measured results are published on this site, because none have been supplied for publication. More on how evidence is handled .
Governance
Privacy and governance in this sector
- Counting, dwell and heatmap outputs are aggregate and identify nobody.
- Where only totals are needed, imagery need not be retained beyond the processing window at all.
- Demographic estimation is a separate decision requiring a lawful basis, impact assessment and signage — the anonymous alternative is recommended wherever it answers the commercial question.
- Staff-area cameras engage employee monitoring obligations and consultation duties.
- Retail analytics data is commercially sensitive and should be access-controlled even though it holds no personal data.
Frequently asked questions
Do we need to replace our store cameras?
Usually not all of them. Entrance cameras often need re-aiming to a steeper angle, and some shop-floor cameras are too low for a useful heatmap. The readiness review reports pass, re-aim or unsuitable per camera so the capital ask is specific rather than a blanket replacement.
How accurate is footfall counting?
It depends entirely on the view. An overhead camera at a normal doorway performs very differently from a wide view across a busy atrium. Accuracy is measured against a manual count on your own doors during the pilot rather than quoted as a general figure.
Can we get shopper demographics?
Aggregate age and gender estimation is available, but it is estimation from appearance, not identity, and it carries real privacy obligations. For most merchandising and staffing questions, anonymous footfall and dwell answer the question and are the recommended default.
Other industries
- Author
- Gabriel Bamola, Chief Marketing Officer, Ayonix
- Technical review
- Dr Sadi Vural, Founder and Chief Executive Officer, Ayonix
- Published
- Last reviewed
Design a retail pilot around your own cameras
Start with a camera readiness review and a log-only baseline, then measure against acceptance criteria we agree before the pilot begins. That is what turns an analytics evaluation into a decision.