Agent activity
Checking for WebMCP support
Requests are only sent after you confirm them. How this works
retail analytics
Queue management that warns before the wait becomes a complaint
In short
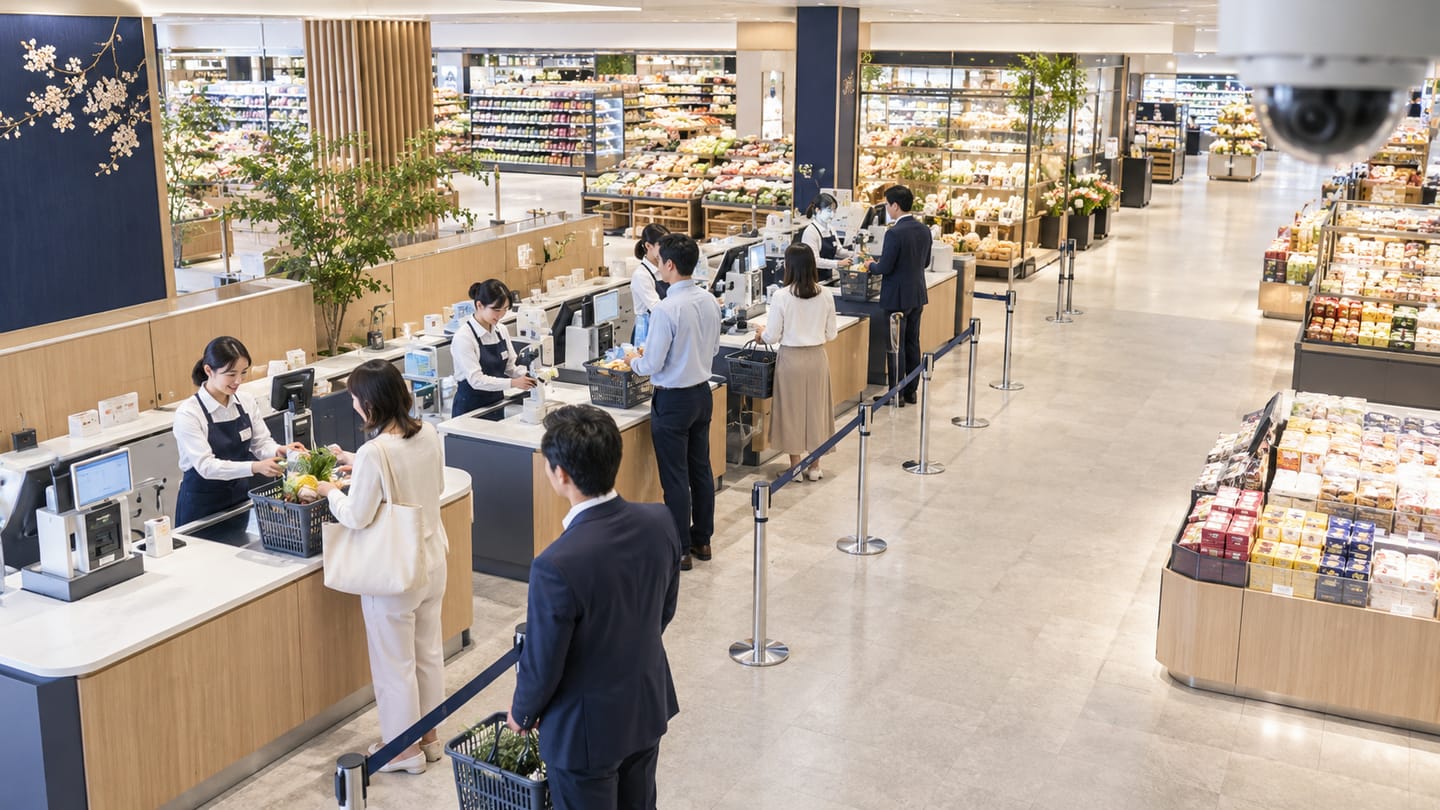
Queue management applies Ayonix dwell measurement and people counting to a defined queue area. It reports how many people are waiting and how long they have been waiting, and raises a warning when either exceeds the service standard, so a supervisor can open another position before customers abandon the queue.
Scope
What this analytic does, and what it does not
What it detects
- Number of people inside a defined queue area
- Time individuals have been waiting in that area
- Queue length and wait time exceeding configured thresholds
- Rate of growth, distinguishing a building queue from a stable one
What it does not guarantee
- Exact wait time for any specific customer
- Reliable measurement in an unstructured queue with no defined area
- Distinction between a queue and people standing nearby for other reasons
- Any prediction of how long a queue will take to clear
The problem
What customers are actually dealing with
These are the situations that lead teams to look at this analytic in the first place.
- Supervisors find out about a queue when a customer complains or abandons their basket.
- Additional positions are opened too late because nobody is watching the queue continuously.
- Service-level targets exist on paper but are never measured, so nobody knows whether they are met.
- Staffing at peak is argued from anecdote because there is no wait-time record.
How it works
Detection workflow
Every event carries the rule that produced it, so an operator can see why they were alerted.
- 1
Ingest and detect
Queue-area cameras are read and people in the defined area are detected and tracked.
- 2
Measure
Queue population and per-track waiting time inside the area are accumulated continuously.
- 3
Evaluate thresholds
Queue length and wait time are tested against the configured service standard.
- 4
Stabilise
A sustained-duration requirement prevents a momentary bunching from raising a warning.
- 5
Deliver
Warnings route to the supervisor channel, and the wait series is written to the dashboard.
Configuration options
- Queue area polygon per lane or per queue group
- Wait-time and queue-length thresholds reflecting the service standard
- Sustained duration before a warning is raised
- Trading-hours schedule and different thresholds by period
- Alert routing to handheld devices, dashboards or the VMS
- Grouping of lanes so a group warning is raised rather than one per lane
Alert quality
How irrelevant and duplicate alerts are reduced
No video analytic eliminates false alerts. These are the mechanisms that reduce them, and the residual rate is measured on your own cameras.
- A sustained-duration requirement prevents a brief bunch of arrivals from triggering a warning.
- Grouping lanes avoids six simultaneous alerts for one queueing situation.
- A minimum dwell before a person is counted as queueing excludes people passing through the area.
- Cooldown prevents repeat warnings while the same queue condition persists.
- Measurement degrades in unstructured queues; the pilot establishes whether the queue area is well enough defined.
Prerequisites
Camera requirements and environmental limits
Camera suitability decides more of the outcome than any software setting. These are assessed per camera before commitment.
Camera requirements
- A view covering the full extent of the queue at its longest, not just the head of the queue
- An elevated angle so people standing behind each other remain separable
- Consistent lighting across the queue area through all trading hours
- Person height of at least 8–10% of frame at the tail of the queue
- Stable mounting so the queue polygon remains aligned
Environmental limitations
- A queue that extends beyond the camera view will be under-reported at exactly the moment it matters.
- Unstructured or branching queues are much harder to measure than a defined lane.
- People standing in the area for other reasons inflate queue population.
- Trolleys and spacing behaviour differ by store format and affect both length and wait measurement.
Delivery
Alerts, evidence and where they land
Event and evidence fields
- Queue area or group name
- Queue population at trigger
- Median and maximum wait at trigger
- Threshold crossed and duration above it
- Camera and site
- Timestamp with timezone
- Event identifier
VMS integration
Queue warnings are usually delivered to supervisor devices rather than the VMS alarm queue, because the responder is on the shop floor rather than in a control room. Where a control room does monitor queues, a VMS custom event with the queue camera is appropriate.
See compatibility states →Deployment options
- Edge processing per store so queue video stays on site
- On-premise processing where checkout cameras already aggregate locally
- Multi-site deployment so the same service standard is measured consistently across the estate
Measurement
Dashboard metrics and pilot acceptance criteria
Acceptance thresholds are agreed with you before the pilot starts. This site publishes no benchmark figures, because they do not transfer between sites.
Dashboard metrics
- Median and 90th-percentile wait per queue group per interval
- Queue population trend
- Threshold breaches per day and per hour of day
- Time to open an additional position after a warning
- Percentage of trading hours within the service standard
- Camera availability per queue area
Measurable pilot criteria
- Wait-time accuracy against stopwatch ground truth for sampled customers
- Queue population accuracy against a manual count at sampled times
- Warning latency from the true threshold breach
- False warnings per trading day from people passing through the area
- Behaviour when the queue extends to its maximum realistic length
Governance
Privacy and governance
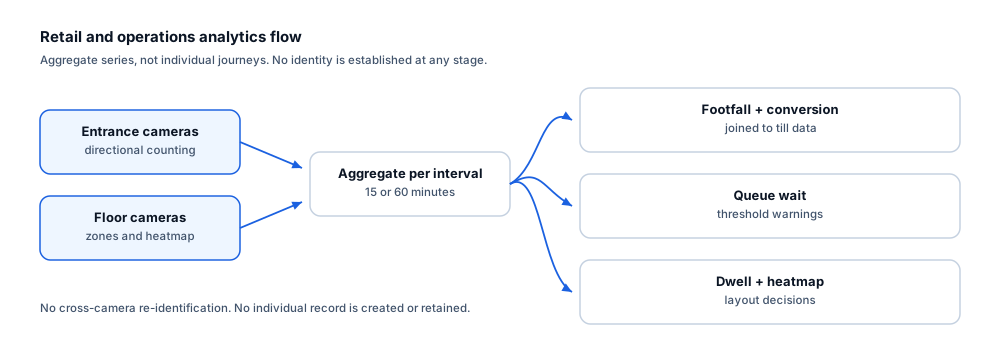
- Wait time is measured per anonymous track and aggregated before reporting.
- No identity is established and no profile is retained across visits.
- Where queue areas include staff positions, employee monitoring obligations may apply.
- Aggregate wait series can be retained without imagery.
Frequently asked questions
Can it measure an unstructured queue?
Less reliably. A defined lane or a marked waiting area produces good measurement. A queue that forms in an open concourse with no fixed shape is much harder, and the readiness review will say so rather than promising a figure that will not hold.
Is the wait time exact for each customer?
No. It is a measurement of time spent in the queue area by an anonymous track, and it can be affected by occlusion and track breaks. Median and percentile figures across many customers are far more dependable than any single reported wait.
Does this need new cameras above every till?
Usually not. One elevated camera covering a group of lanes is often better than several low cameras, because it sees the full queue extent. Camera suitability is assessed per queue area during the readiness review.
Keep reading
Related solutions and industries
Related solutions
-
Dwell time analytics
Measure how long people remain in defined areas such as counters, displays and waiting halls, an…
-
People counting
Count directional footfall across a virtual line using existing cameras, compare peak periods an…
-
Occupancy analytics
Report how intensively rooms, floors and zones are used over time, so space, cleaning and energy…
-
Customer flow analytics
Combine directional counting, dwell and heatmaps to show how visitors move through a space, whic…
Where it is used
-
Retail
Video analytics for stores that already have the cameras
-
Shopping malls
Video analytics for shopping centre leasing and operations
-
Airports
Video analytics for airport terminals and airside boundaries
-
Healthcare
Video analytics for healthcare estates and public areas
- Author
- Gabriel Bamola, Chief Marketing Officer, Ayonix
- Technical review
- Dr Sadi Vural, Founder and Chief Executive Officer, Ayonix
- Published
- Last reviewed
Evaluate queue management on your own cameras
A controlled pilot establishes what this analytic actually does in your environment, against acceptance criteria we agree before it starts. Send a sample video first if you would rather see an assessment before committing to a pilot.