Agent activity
Checking for WebMCP support
Requests are only sent after you confirm them. How this works
traffic analytics
Parking occupancy analytics without a sensor in every bay
In short
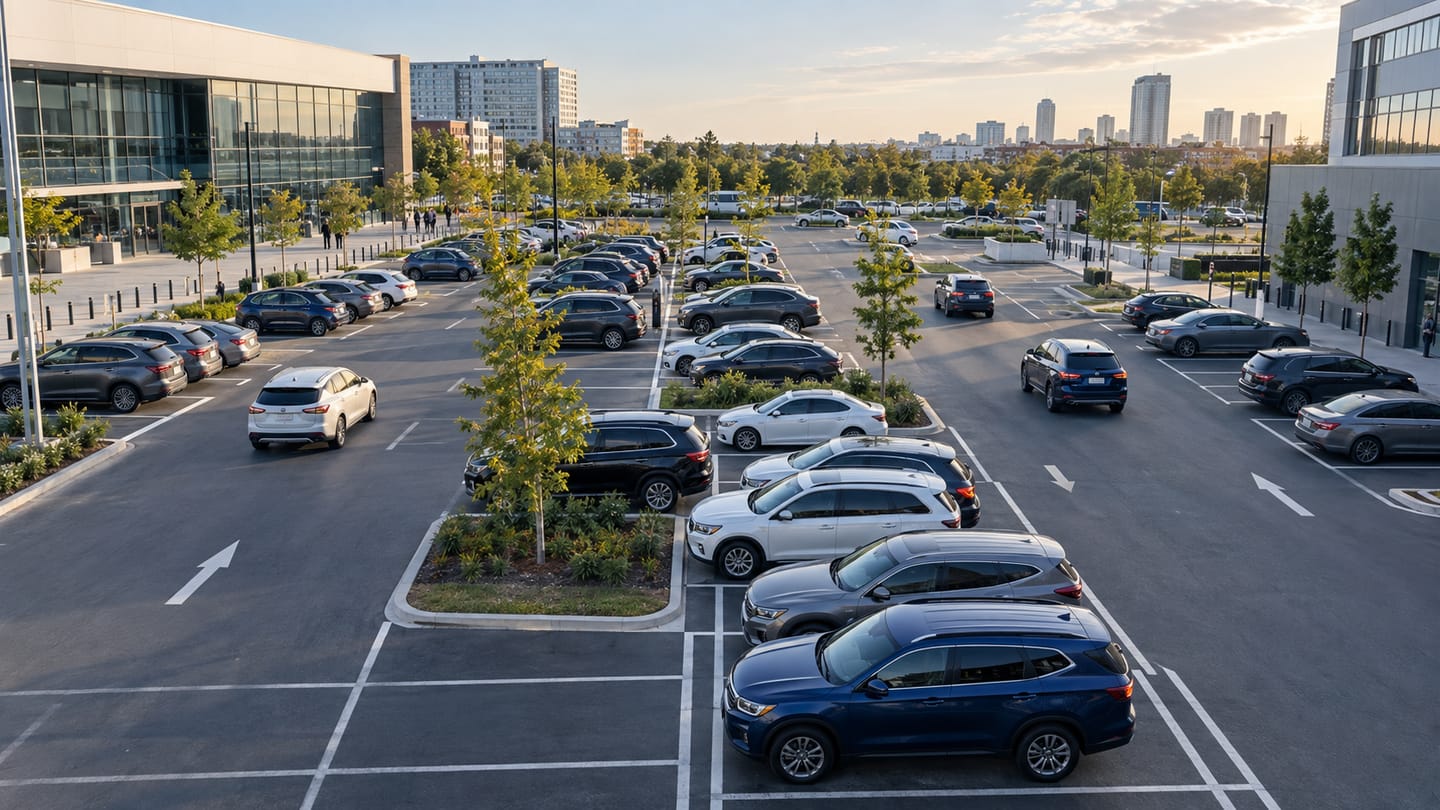
Parking occupancy analytics uses Ayonix vehicle detection over defined bay or area zones to report how full a car park is, live and over time. Because Ayonix detects vehicles in parking areas from existing cameras, occupancy can be reported per area or per bay without installing a sensor in each space.
Scope
What this analytic does, and what it does not
What it detects
- Occupied and free state per bay or per area zone
- Area occupancy percentage against capacity
- Duration a bay has been continuously occupied
- Occupancy trend across the day and week
What it does not guarantee
- Per-bay accuracy in views where vehicles occlude each other
- Identification of which vehicle is in which bay
- Enforcement-grade evidence of overstay on its own
- Correct capacity where bay markings and configured zones diverge
The problem
What customers are actually dealing with
These are the situations that lead teams to look at this analytic in the first place.
- Drivers circulate looking for spaces while whole areas of the car park sit empty.
- Per-bay sensors were quoted and the cost and civil works ruled out the project.
- Operators know the site is full only when the queue reaches the entrance.
- Overstay is suspected but there is no record of how long bays are actually held.
How it works
Detection workflow
Every event carries the rule that produced it, so an operator can see why they were alerted.
- 1
Ingest and detect
Car park cameras are read and vehicles in frame are detected and tracked.
- 2
Evaluate zones
Bay or area polygons are tested for vehicle presence with a stationary threshold applied.
- 3
Derive occupancy
Occupied counts are aggregated per area and compared against configured capacity.
- 4
Stabilise
A confirmation window prevents a vehicle manoeuvring through a bay from toggling its state.
- 5
Publish
Live occupancy is pushed to signage and dashboards, and the series is retained for planning.
Configuration options
- Bay polygons for per-space reporting, or area polygons with a configured capacity
- Stationary threshold before a bay is marked occupied
- State-change confirmation window
- Area capacity values, reconciled against the physical bay count
- Occupancy thresholds for signage states such as spaces, limited and full
- Reporting interval for the historic series
Alert quality
How irrelevant and duplicate alerts are reduced
No video analytic eliminates false alerts. These are the mechanisms that reduce them, and the residual rate is measured on your own cameras.
- A stationary threshold prevents a vehicle driving through a bay from flipping its state.
- A confirmation window suppresses rapid toggling during manoeuvring.
- Area-level reporting is markedly more robust than per-bay reporting in oblique views and is often the better choice.
- Reconciling configured capacity against the physical bay count prevents a silent percentage error.
- Occlusion in packed areas remains the dominant limitation and is measured per camera during the pilot.
Prerequisites
Camera requirements and environmental limits
Camera suitability decides more of the outcome than any software setting. These are assessed per camera before commitment.
Camera requirements
- Elevated placement so that front-row vehicles do not hide the rows behind them
- A view where the furthest bay of interest still occupies a usable portion of the frame
- Night illumination adequate across the whole area, not only near the entrance
- Stable mounting so bay polygons remain aligned with painted markings
- Exposure that copes with a mix of shaded and sunlit areas in the same view
Environmental limitations
- Per-bay state in a low, oblique view is unreliable for rear rows; area reporting should be used instead.
- Snow cover, standing water and heavy shadow change vehicle appearance and affect state detection.
- Multi-storey decks need per-level coverage; one camera cannot represent a deck it cannot see.
- Oversized vehicles spanning two bays require a documented handling rule.
Delivery
Alerts, evidence and where they land
Event and evidence fields
- Area or bay identifier
- Occupied state and confirmation timestamp
- Continuous occupied duration
- Area occupancy count and percentage
- Capacity used for the calculation
- Camera availability for the area
VMS integration
Occupancy state is an operational data feed for signage and dashboards. Where a restricted bay or area also needs a security rule, vehicle zone events are delivered to the VMS alongside.
See compatibility states →Deployment options
- Edge processing at the car park so occupancy survives a WAN outage and continues to drive local signage
- On-premise processing where car park cameras already aggregate to a site server
- Multi-site deployment where a parking operator compares utilisation across a portfolio
Measurement
Dashboard metrics and pilot acceptance criteria
Acceptance thresholds are agreed with you before the pilot starts. This site publishes no benchmark figures, because they do not transfer between sites.
Dashboard metrics
- Live occupancy per area and site total
- Peak occupancy and time of peak per area
- Occupancy duration distribution per bay or area
- Hours per week above a utilisation threshold
- Area-level turnover per day
- Camera availability per area
Measurable pilot criteria
- Occupancy accuracy against a manual audit at full, mid and low occupancy
- Per-bay state accuracy by row, reported separately for front and rear rows
- Night performance measured across the whole area, not just near lighting
- State-change latency from physical arrival and departure
- Reconciliation of configured capacity against a physical bay count
Governance
Privacy and governance
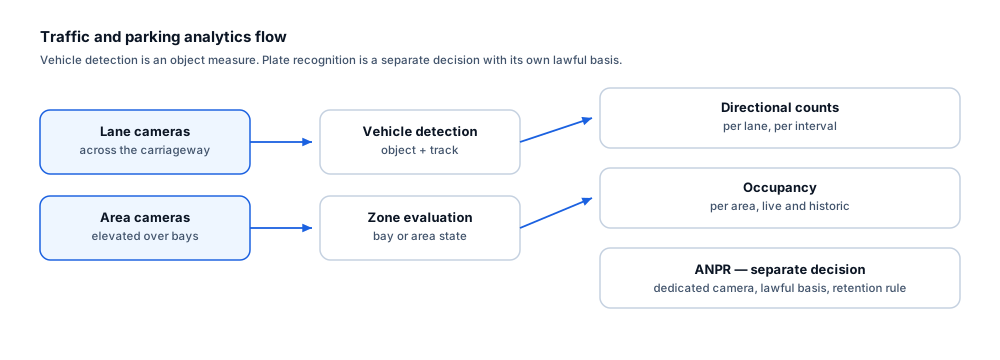
- Occupancy is derived from vehicle presence as an object. No plate is read and no keeper is identified.
- Where dwell duration per bay is used for enforcement, plate-level evidence would be required and that is a separate ANPR decision with its own lawful basis.
- Aggregate occupancy series can be retained without retaining imagery.
Frequently asked questions
Do we need a sensor in every bay?
Not where camera coverage is adequate. Detection over bay or area zones from existing cameras avoids per-bay hardware and civil works. Where a view cannot resolve rear rows reliably, area-level reporting is used for that camera rather than claiming per-bay accuracy it cannot deliver.
Can it be used to enforce overstay?
It can show that a bay has been continuously occupied for a period, but it does not identify the vehicle. Enforcement normally needs plate-level evidence, which is an ANPR decision with its own camera requirements and lawful basis.
What about multi-storey car parks?
Each deck needs its own coverage; a camera cannot report on a level it cannot see. Decks are treated as separate areas with their own capacity, and the readiness review confirms coverage level by level.
Keep reading
Related solutions and industries
Related solutions
-
Vehicle detection
Detect vehicles in parking areas, yards and monitored locations using existing cameras, as the b…
-
Vehicle counting
Count vehicles crossing a line by direction to measure throughput at entrances, lanes and access…
-
ANPR / licence plate recognition
What ANPR requires to work — camera angle, shutter speed, lighting, plate format and retention —…
-
Occupancy analytics
Report how intensively rooms, floors and zones are used over time, so space, cleaning and energy…
Where it is used
-
Parking
Video analytics for car parks without a sensor in every bay
-
Shopping malls
Video analytics for shopping centre leasing and operations
-
Healthcare
Video analytics for healthcare estates and public areas
-
Airports
Video analytics for airport terminals and airside boundaries
- Author
- Gabriel Bamola, Chief Marketing Officer, Ayonix
- Technical review
- Dr Sadi Vural, Founder and Chief Executive Officer, Ayonix
- Published
- Last reviewed
Evaluate parking occupancy analytics on your own cameras
A controlled pilot establishes what this analytic actually does in your environment, against acceptance criteria we agree before it starts. Send a sample video first if you would rather see an assessment before committing to a pilot.