Agent activity
Checking for WebMCP support
Requests are only sent after you confirm them. How this works
operations analytics
Entrance and exit analytics for every door that matters
In short
Entrance and exit analytics reports directional volumes at each doorway of a building or site. Ayonix people counting already counts entry and exit traffic and compares peak periods; applied across every entrance, it shows which doors carry the load, when, and how that changes through the week.
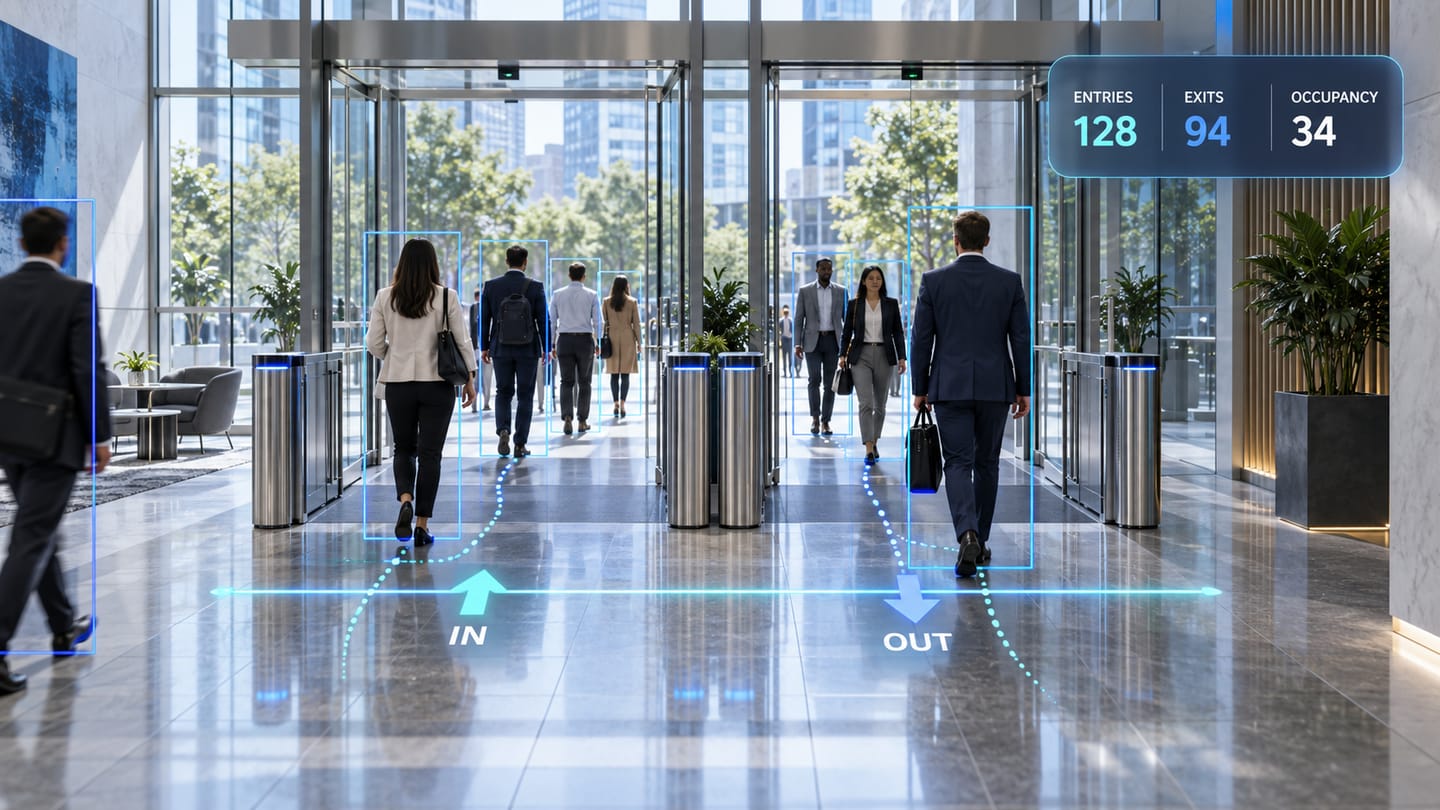
In context
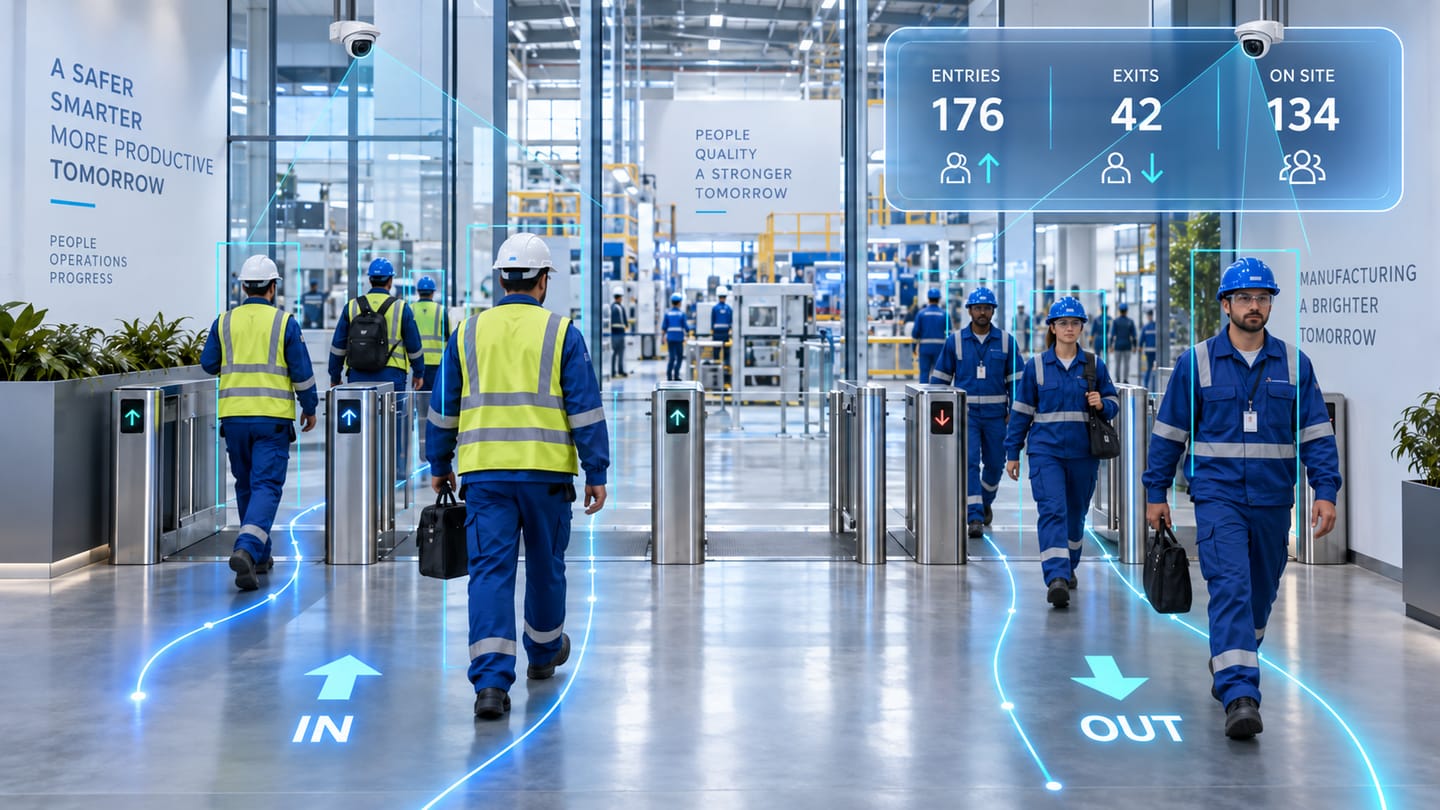
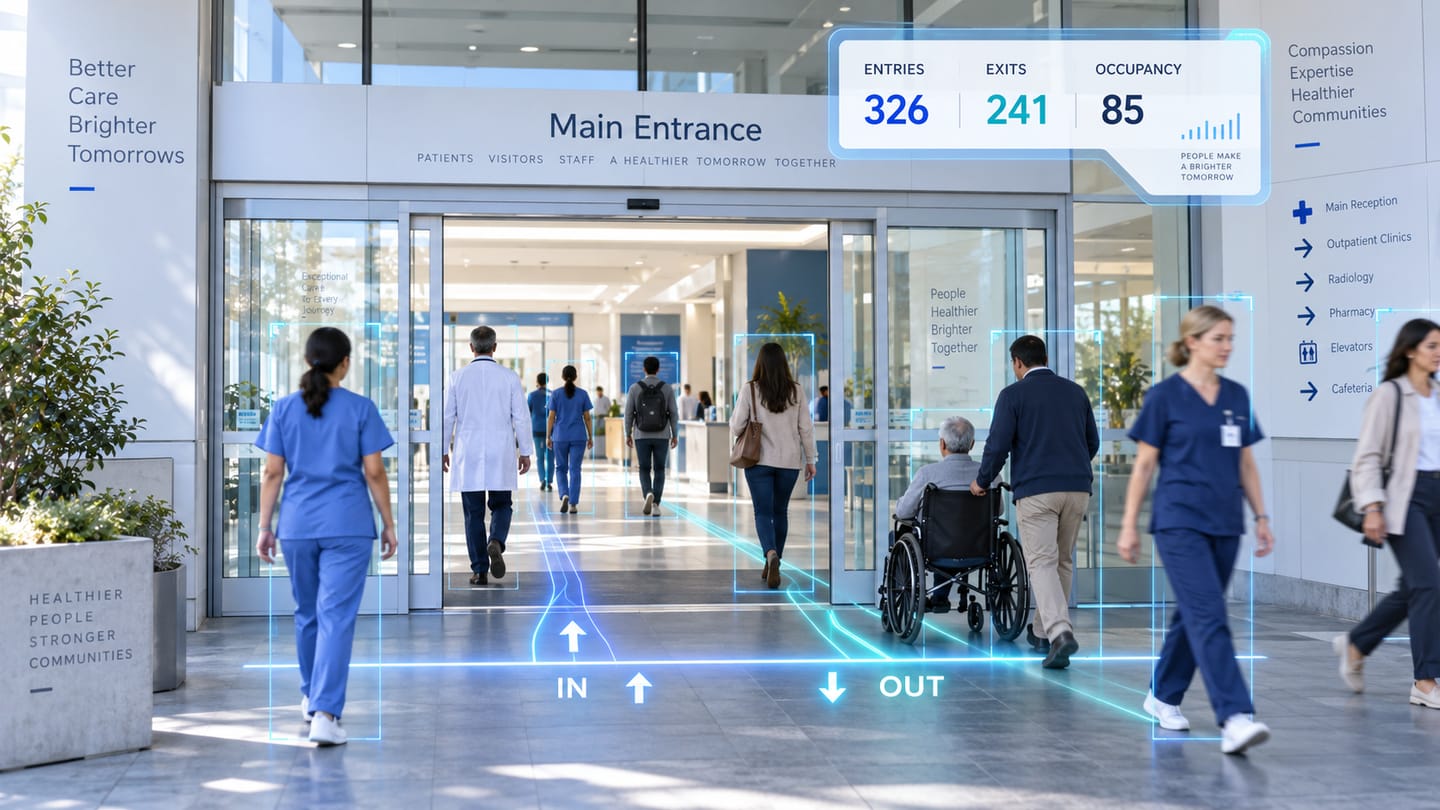
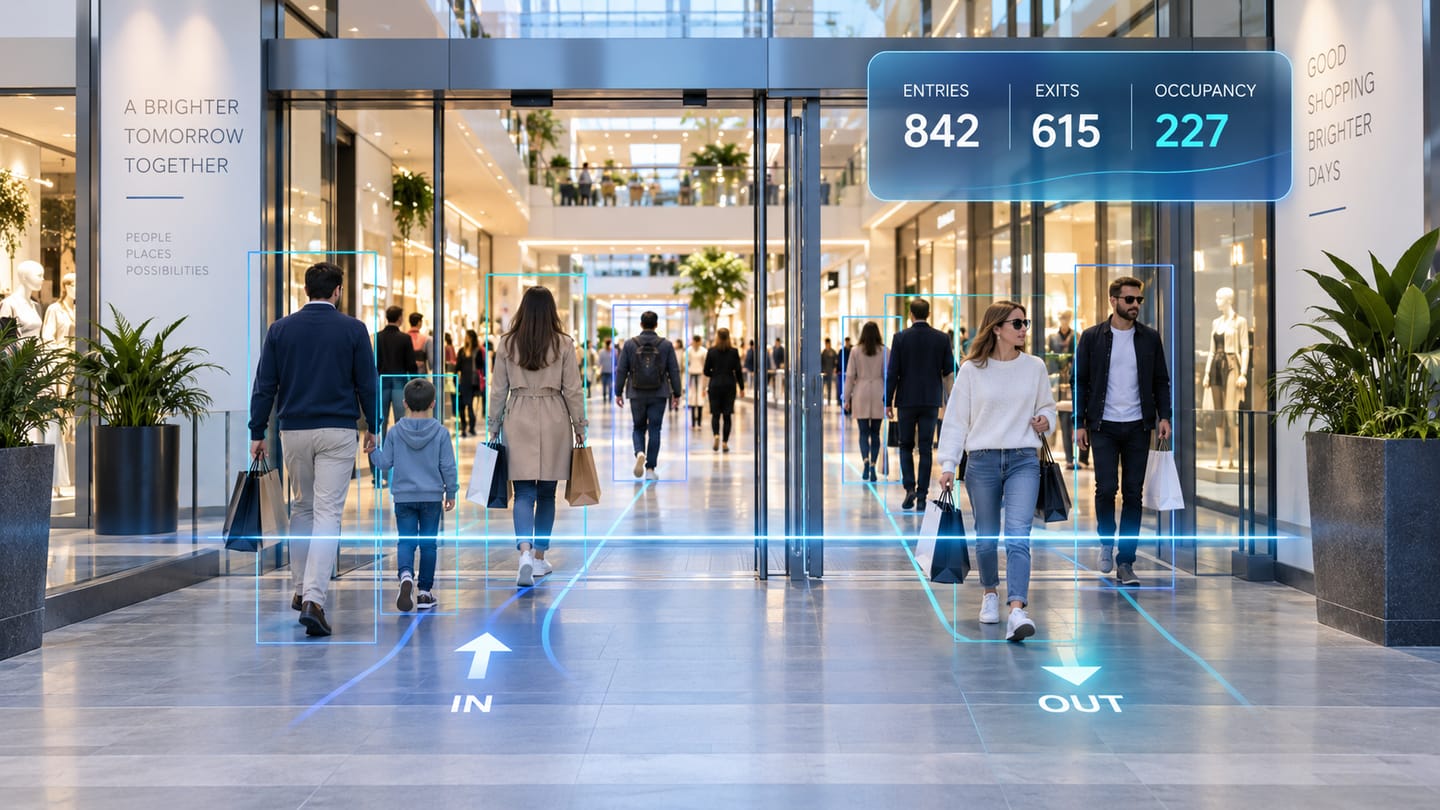
Entrance and exit analytics across different settings
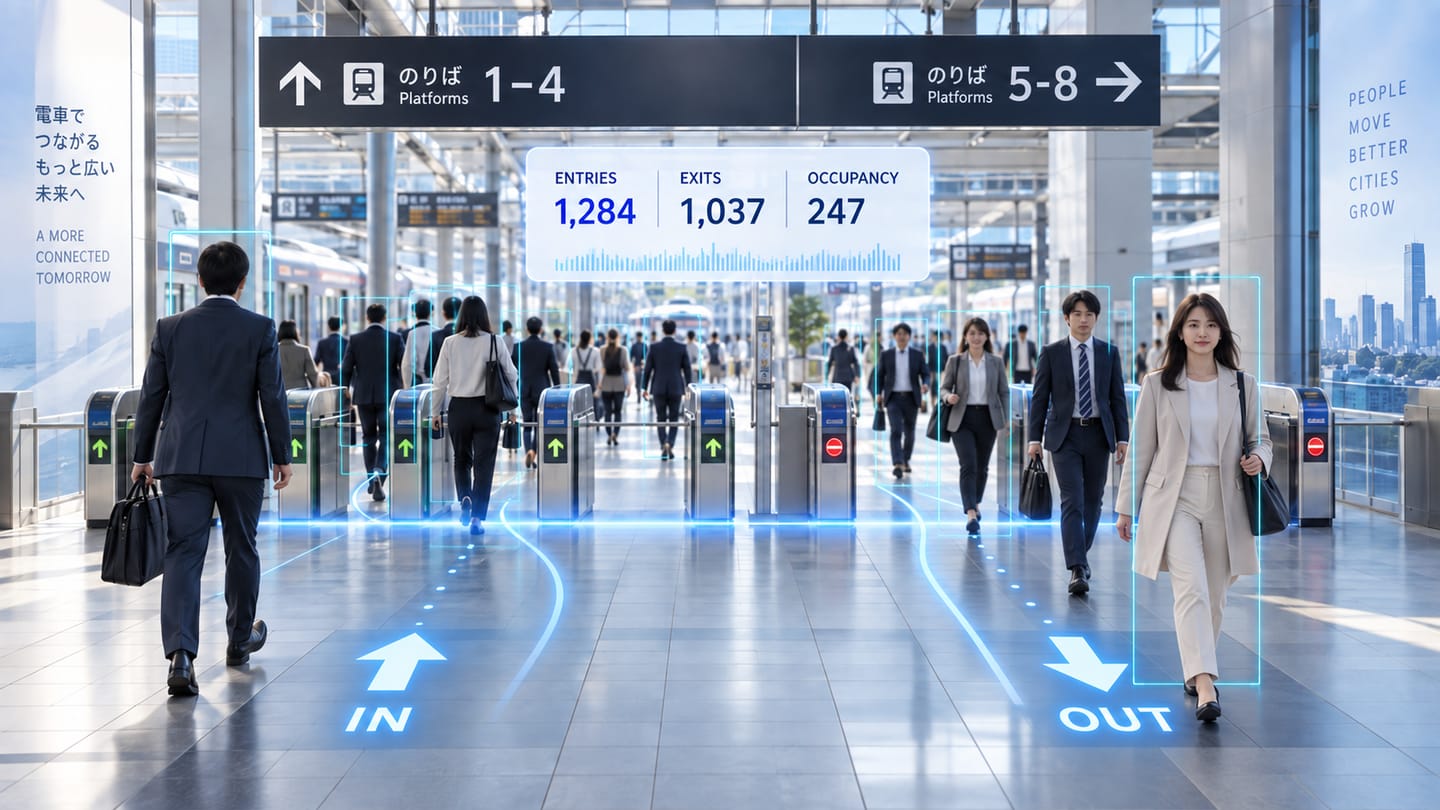
The same directional counting, applied at different kinds of doorway. The figures shown are illustrative, not measured Ayonix results.
Scope
What this analytic does, and what it does not
What it detects
- Entry and exit counts per doorway per interval
- Peak arrival and departure periods per entrance
- Entrance share of total building traffic
- Imbalance between entries and exits over a period
What it does not guarantee
- A building occupancy figure without every bounding door being counted
- Distinction between staff, visitors and contractors
- Accurate counts through very wide doorways where people pass abreast
- Any individual identification or access record
The problem
What customers are actually dealing with
These are the situations that lead teams to look at this analytic in the first place.
- Reception is staffed for a peak that no longer happens, because arrival patterns changed and nobody measured it.
- Cleaning and security rounds are scheduled against assumptions about when doors are busy.
- A building has six entrances and no data showing which are genuinely used.
- Access-control badge data covers only badge-controlled doors and misses visitor and public entrances entirely.
How it works
Detection workflow
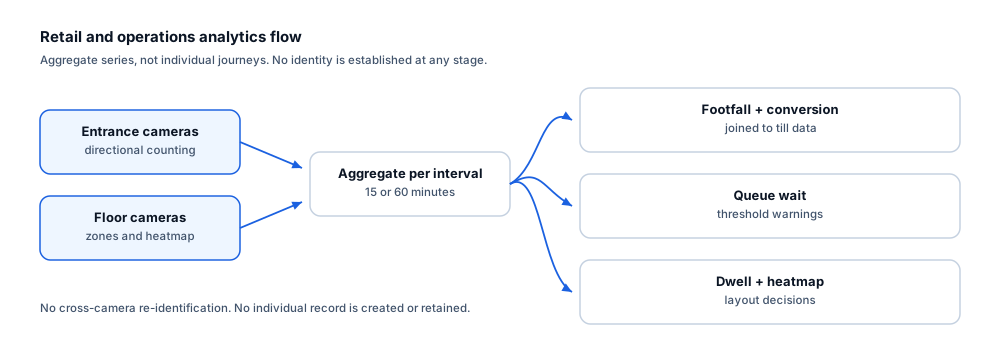
Every event carries the rule that produced it, so an operator can see why they were alerted.
- 1
Ingest
Every bounding doorway camera is read and monitored for availability.
- 2
Count directionally
Each doorway produces entry and exit counts from directional line crossing.
- 3
Aggregate
Counts are accumulated per interval per doorway and rolled up per building.
- 4
Compare
Intervals are compared across days and weeks to establish arrival and departure patterns.
- 5
Publish
Per-door and per-building series are written to the dashboard and made available for export.
Configuration options
- Counting line per doorway with consistent entry and exit direction labelling
- Grouping of doorways into buildings, zones or the whole site
- Reporting intervals and the working-hours schedule
- Exclusion of service and goods doors from headline figures where appropriate
- Handling of revolving doors, airlocks and double-leaf entrances
- Whether out-of-hours movement is reported as a separate series
Alert quality
How irrelevant and duplicate alerts are reduced
No video analytic eliminates false alerts. These are the mechanisms that reduce them, and the residual rate is measured on your own cameras.
- Consistent direction labelling across every door is what makes building-level rollup meaningful.
- Track-based counting ensures one person produces one count per crossing.
- Separating service doors prevents deliveries from distorting the occupancy-relevant figures.
- Reporting availability alongside counts makes gaps visible rather than silently lowering totals.
- Group entry through wide doors remains the dominant error source and is quantified during the pilot.
Prerequisites
Camera requirements and environmental limits
Camera suitability decides more of the outcome than any software setting. These are assessed per camera before commitment.
Camera requirements
- A counting-suitable view at every doorway included in the analysis
- Overhead or steeply angled placement at each threshold
- A field of view spanning the full door width, including both leaves of a double door
- Consistent lighting at the threshold, including strong daylight through glazed entrances
- Frame rate of 12–15 fps or higher at each counted door
Environmental limitations
- Revolving doors and airlocks need careful line placement and specific acceptance testing.
- A doorway that is not counted leaves a gap in every building-level figure derived from the set.
- Wide entrances where groups pass abreast are the main source of under-counting.
- Counts do not distinguish between people entering to work and people entering to visit.
Delivery
Alerts, evidence and where they land
Event and evidence fields
- Doorway and building identifier
- Interval start and end with timezone
- Entries and exits in the interval
- Net flow and cumulative net for the day
- Camera availability percentage
- Out-of-hours flag
VMS integration
Entrance analytics is a reporting series. Where a door also needs an out-of-hours crossing alert, the line crossing configuration provides that event to the VMS while the same line continues to produce counts.
See compatibility states →Deployment options
- Edge processing per building so only aggregate counts traverse the network
- On-premise processing where all doorway cameras already aggregate to a site server
- Multi-site deployment for consistent measurement across a property portfolio
Measurement
Dashboard metrics and pilot acceptance criteria
Acceptance thresholds are agreed with you before the pilot starts. This site publishes no benchmark figures, because they do not transfer between sites.
Dashboard metrics
- Entries and exits per doorway per interval
- Building totals and entrance share
- Arrival and departure peak times per building
- Weekday versus weekend pattern
- Out-of-hours movement per door
- Counting availability per doorway
Measurable pilot criteria
- Counting error per doorway against a manual count at peak and off-peak
- Direction accuracy per doorway, measured separately
- Specific acceptance test for any revolving door or airlock in scope
- Interval completeness across a full working week
- Consistency of building rollup against the sum of its doors
Governance
Privacy and governance
- Output is aggregate counts per doorway. No identity, badge record or face template is involved.
- Where counts cover staff entrances, employee monitoring obligations and consultation duties may apply.
- Aggregate series can be retained without retaining any imagery.
Frequently asked questions
Is this the same as people counting?
It uses the same directional counting mechanism, applied across every doorway of a building and rolled up. The distinction is one of scope and reporting: people counting typically answers a footfall question at one entrance, while entrance and exit analytics describes the whole building.
Can we use badge data instead?
Badge data covers badge-controlled doors and badge-holders. It misses visitors, public entrances and tailgating. The two are complementary — badge data is authoritative for access, camera counting is more complete for movement.
What about revolving doors?
They are workable but need careful line placement and their own acceptance test, because the geometry and the way people enter differ from a standard doorway. They are always tested individually rather than assumed to behave like other doors.
Keep reading
Related solutions and industries
Related solutions
-
People counting
Count directional footfall across a virtual line using existing cameras, compare peak periods an…
-
Occupancy analytics
Report how intensively rooms, floors and zones are used over time, so space, cleaning and energy…
-
Line crossing detection
Raise an event when a person or vehicle crosses a virtual line in a defined direction, using the…
-
Customer flow analytics
Combine directional counting, dwell and heatmaps to show how visitors move through a space, whic…
Where it is used
-
Corporate buildings
Video analytics for workplace utilisation and building security
-
Education
Video analytics for education estates and campus security
-
Healthcare
Video analytics for healthcare estates and public areas
-
Shopping malls
Video analytics for shopping centre leasing and operations
- Author
- Gabriel Bamola, Chief Marketing Officer, Ayonix
- Technical review
- Dr Sadi Vural, Founder and Chief Executive Officer, Ayonix
- Published
- Last reviewed
Evaluate entrance and exit analytics on your own cameras
A controlled pilot establishes what this analytic actually does in your environment, against acceptance criteria we agree before it starts. Send a sample video first if you would rather see an assessment before committing to a pilot.