Agent activity
Checking for WebMCP support
Requests are only sent after you confirm them. How this works
Industry
Video analytics for stadium gates, concourses and event spaces
In short
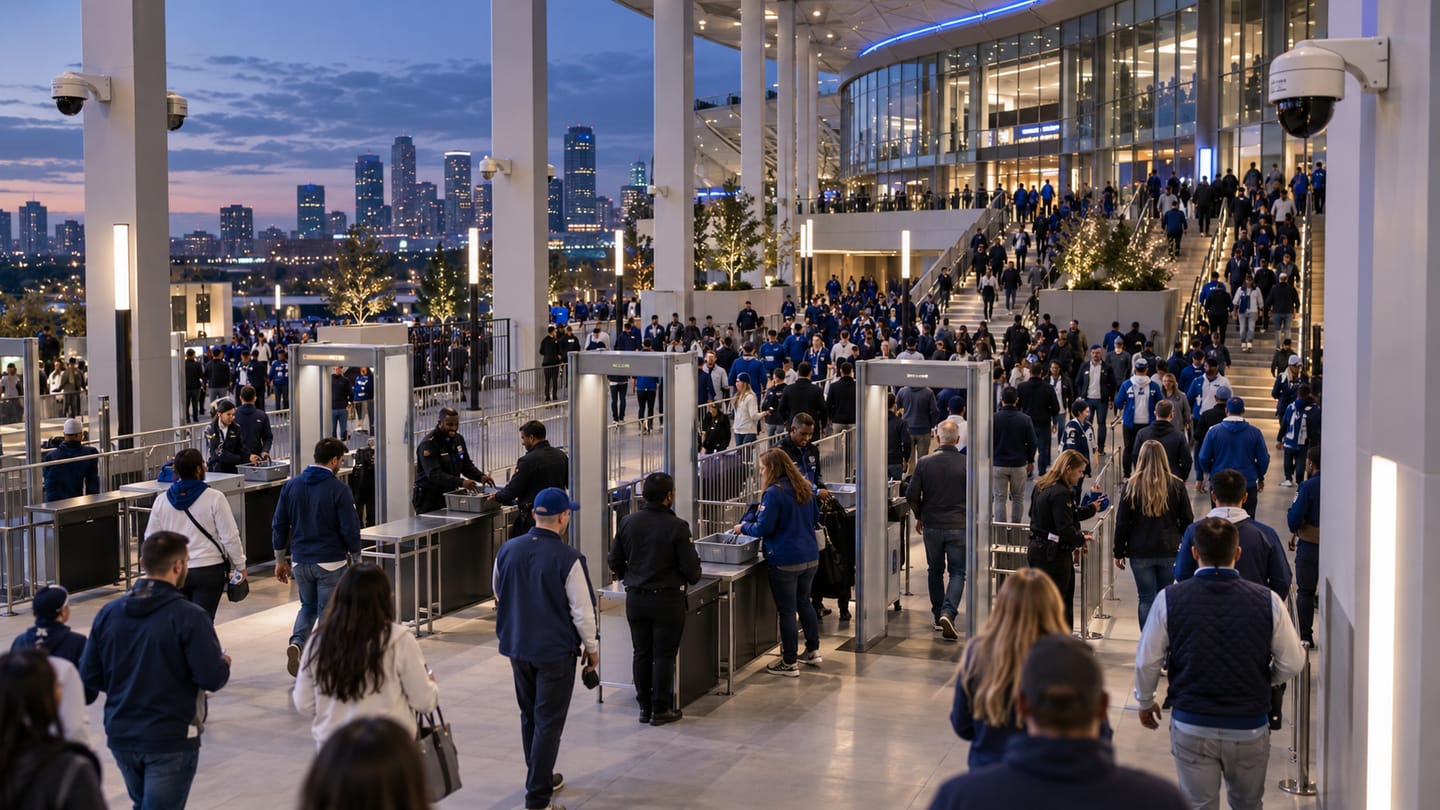
Stadium video analytics measures gate throughput during ingress, concourse density during the event, and zone occupancy against venue limits. Density bands are calibrated to the levels the venue crowd-safety plan already recognises, so warnings mean something to the safety officer.
The problem
What stadiums and events teams are dealing with
- Ingress rate is judged by eye and a slow gate is identified after the queue has already built outside.
- Concourse crowding at half-time is a known risk with no consistent measurement.
- Zone occupancy limits exist on paper and are monitored by stewards walking the area.
- Post-event review of a crowding incident relies on recollection rather than a record.
- Different events have completely different crowd profiles and one fixed threshold fits none of them.
Recommended
Analytics that address these problems
Only capabilities Ayonix publishes appear here. Each links to its full scope, camera requirements and limitations.
- Solution-design configuration
Crowd density monitoring
Crowd density monitoring estimates how densely people occupy defined regions of a camera view and trends that estimate over time. It gives control-r…
Read the detail → - Published capability
People counting
Ayonix people counting counts movement across a virtual line on an existing camera view and compares directional flow through the day. It produces e…
Read the detail → - Solution-design configuration
Occupancy monitoring
Occupancy monitoring maintains a running count of people inside a defined space by combining directional entry and exit counts at every doorway. Thr…
Read the detail → - Solution-design configuration
Entrance and exit analytics
Entrance and exit analytics reports directional volumes at each doorway of a building or site. Ayonix people counting already counts entry and exit …
Read the detail → - Solution-design configuration
Queue management
Queue management applies Ayonix dwell measurement and people counting to a defined queue area. It reports how many people are waiting and how long t…
Read the detail → - Published capability
Restricted area monitoring
Restricted area monitoring raises an event when a person or vehicle is present inside a zone that should be empty or access-controlled at that time.…
Read the detail →
Camera placement
Where cameras need to be, and why
Camera position decides more of the outcome than any software setting. These are the placements that matter in this sector.
| Location | Purpose | What matters |
|---|---|---|
| Turnstile and gate lines | Throughput counting | Overhead placement per gate group; ingress rate is the key ingress-phase metric. |
| Outer queueing areas | Density banding | Elevated views over the approach so build-up outside is visible before it reaches the gate. |
| Concourse | Density by region | Regions aligned to physical constraint points rather than arbitrary camera coverage. |
| Stair and vomitory approaches | Density and rate of change | These are the genuine pinch points and deserve their own regions. |
| Restricted and back-of-house areas | Schedule-aware presence | Event-day schedules differ entirely from non-event days. |
Workflow
From event to acknowledged action
Event workflow
- 1 Venue cameras are ingested; event-day schedules are selected for the fixture profile.
- 2 Gate throughput is counted per gate group during ingress.
- 3 Concourse and approach density is estimated per region and smoothed.
- 4 Sustained-band and rate-of-change rules raise warnings to the control room.
- 5 Zone occupancy is derived against venue limits where doorways permit.
- 6 Density and throughput history is retained for the post-event safety review.
Operator workflow
- 1 Safety officer sees ingress rate per gate group and redirects stewards to a slow gate.
- 2 A concourse density warning names the region and the duration in band.
- 3 The documented crowd-management measure is applied and its timing recorded.
- 4 Zone occupancy approaching a limit prompts steward attendance.
- 5 Post-event debrief uses the density and throughput record rather than recollection.
Operations
Dashboards, integration and deployment
Dashboard metrics
- Ingress rate per gate group by interval
- Concourse density band by region
- Minutes in upper band per region per event
- Zone occupancy against limit
- Warning-to-action time
- Camera availability across the venue
Integration options
- VMS alarm delivery with automatic camera call-up to the control room
- Webhook delivery into venue control and steward-deployment systems
- REST retrieval for post-event safety reporting
- ONVIF and RTSP ingestion from the venue camera estate
Deployment options
- On-premise processing at the venue, which is the normal choice
- Edge processing for outlying gates and remote approaches
- Multi-site management across a venue portfolio
- Event-profile configuration switching between fixture types
Evidence
Deployment pattern
Event-day pattern
Gate throughput counting during ingress, calibrated concourse density banding during the event, and zone occupancy against venue limits, with event-profile switching per fixture.
Bands are calibrated to your own venue and your own crowd-safety plan across multiple fixtures. No thresholds or figures from other venues are published.
This is an anonymised pattern describing how a deployment of this kind is structured. It is not a named customer reference. No customer names, logos, testimonials or measured results are published on this site, because none have been supplied for publication. More on how evidence is handled .
Governance
Privacy and governance in this sector
- Density, counting and occupancy outputs are aggregate; no spectator is identified by these analytics.
- Venue privacy notices and ticket terms should cover the analytics purpose, not only CCTV recording.
- Density thresholds should be set by the venue safety officer against the existing crowd-safety plan, not by the vendor.
- Behaviour-classification analytics is outside the published Ayonix capability set and is not deployed here.
- Density history retention is low-risk because it holds no imagery and is valuable for safety review.
Frequently asked questions
Can it count the crowd in the concourse?
Not reliably once density is high, because people occlude each other. Calibrated density bands are reported instead, set against the levels your crowd-safety plan already recognises, which is both more honest and more actionable for a safety officer.
Do thresholds need to change per event?
Usually yes. A family fixture and a high-attendance derby produce different crowd profiles, so event-profile configurations are selected per fixture rather than running one fixed threshold across all of them.
Can it detect disorder or aggression?
No. Behaviour-classification analytics is not part of the published Ayonix capability set and is not offered here. Density, throughput and occupancy measurement supports the safety operation without claiming to interpret behaviour.
Other industries
- Author
- Gabriel Bamola, Chief Marketing Officer, Ayonix
- Technical review
- Dr Sadi Vural, Founder and Chief Executive Officer, Ayonix
- Published
- Last reviewed
Design a stadiums and events pilot around your own cameras
Start with a camera readiness review and a log-only baseline, then measure against acceptance criteria we agree before the pilot begins. That is what turns an analytics evaluation into a decision.