Agent activity
Checking for WebMCP support
Requests are only sent after you confirm them. How this works
retail analytics
Dwell time analytics that show where attention actually goes
In short
Ayonix dwell analysis measures how long people remain in defined areas of a camera view. Reported as distributions rather than single averages, dwell shows which displays, counters and waiting areas hold attention, how that changes by hour, and how a layout change altered behaviour.
Scope
What this analytic does, and what it does not
What it detects
- Time each tracked person spends inside a defined zone
- Dwell distribution per zone, not only the mean
- Number of distinct visits to a zone per interval
- Change in dwell between comparable periods
What it does not guarantee
- Why a person stayed — dwell measures duration, not interest or intent
- Accurate dwell where the person is occluded for long periods
- Individual-level tracking between zones or across visits
- A causal link between dwell and sales
The problem
What customers are actually dealing with
These are the situations that lead teams to look at this analytic in the first place.
- A merchandising change is made and nobody can say whether it altered behaviour, only whether sales moved for other reasons too.
- Average dwell hides the distinction between many brief passes and a few long stops, which are very different situations.
- Waiting areas are sized from assumption rather than measured waiting behaviour.
- Teams debate which displays work using anecdote because there is no consistent measurement.
How it works
Detection workflow
Every event carries the rule that produced it, so an operator can see why they were alerted.
- 1
Ingest and detect
Zone cameras are read and people in frame are detected and tracked.
- 2
Accumulate dwell
Each track accumulates time inside each zone polygon it enters.
- 3
Close visits
A visit is closed when the track leaves the zone beyond the brief-exit tolerance or the track ends.
- 4
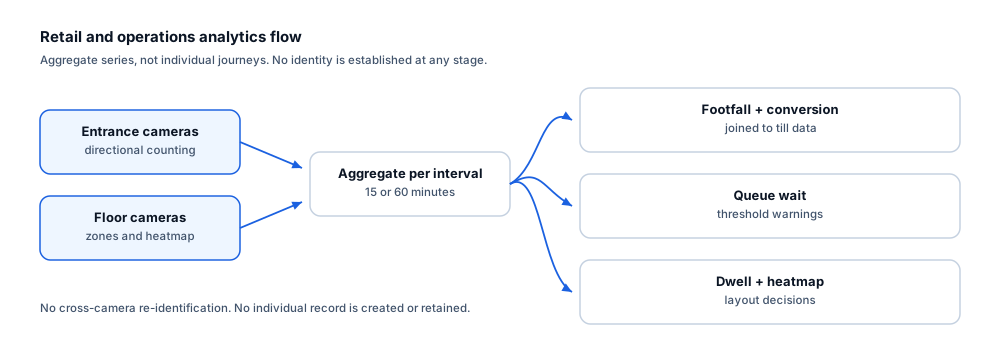
Aggregate
Visits are aggregated into distributions, medians and percentiles per interval.
- 5
Publish
Zone dwell series are written to the dashboard and made available for export.
Configuration options
- Zone polygons per camera, aligned to displays, counters or waiting areas
- Brief-exit tolerance before a visit is considered closed
- Minimum dwell before a visit is recorded, filtering pass-through traffic
- Reporting intervals and the percentiles reported alongside the median
- Comparison baselines for before-and-after measurement
- Trading-hours schedule so closed periods are excluded
Alert quality
How irrelevant and duplicate alerts are reduced
No video analytic eliminates false alerts. These are the mechanisms that reduce them, and the residual rate is measured on your own cameras.
- A minimum dwell threshold separates genuine stops from people simply walking through the zone.
- Brief-exit tolerance prevents one visit being split into several by a momentary step away.
- Reporting distributions rather than a single average prevents a handful of very long dwells from distorting the picture.
- Excluding closed hours prevents cleaning and restocking activity from contaminating the series.
- Occlusion breaks tracks and truncates dwell; the effect is quantified per zone during the pilot.
Prerequisites
Camera requirements and environmental limits
Camera suitability decides more of the outcome than any software setting. These are assessed per camera before commitment.
Camera requirements
- A view that keeps the subject visible for the whole expected dwell, not just at the zone boundary
- An elevated angle that limits occlusion between people standing close together
- Person height of at least 8–10% of frame across the zone
- Stable, consistent lighting across trading hours
- A zone that fits comfortably within the field of view with margin at the edges
Environmental limitations
- Dwell is systematically under-reported where fixtures, pillars or other shoppers occlude the subject.
- In crowded zones, tracks merge and dwell measurement degrades.
- Dwell alone does not indicate interest — a queue produces long dwell for reasons unrelated to the display beside it.
- Comparison between zones is only fair when camera views are comparable.
Delivery
Alerts, evidence and where they land
Event and evidence fields
- Zone name and camera
- Interval start and end
- Visit count in the interval
- Median dwell and selected percentiles
- Mean dwell
- Track break rate for the interval
VMS integration
Dwell analytics is a reporting series rather than an operator alarm. Where the same zone also needs a security threshold, the dwell alerting configuration is used alongside it and delivers events to the VMS.
See compatibility states →Deployment options
- Edge processing per store or terminal so only aggregate dwell series leave the site
- On-premise processing where zone cameras already aggregate locally
- Hybrid deployment for estate-wide comparison of comparable zones
Measurement
Dashboard metrics and pilot acceptance criteria
Acceptance thresholds are agreed with you before the pilot starts. This site publishes no benchmark figures, because they do not transfer between sites.
Dashboard metrics
- Median and percentile dwell per zone per interval
- Visit count per zone
- Dwell distribution shape, shown as a histogram
- Before-and-after comparison against a baseline period
- Zone ranking by median dwell
- Track break rate as a data-quality indicator
Measurable pilot criteria
- Dwell accuracy against stopwatch ground truth for a set of scripted stays of varied length
- Track break rate per zone and its measured effect on reported dwell
- Stability of the median across two comparable days
- Behaviour of the minimum-dwell filter against scripted pass-throughs
- Data completeness across trading hours
Governance
Privacy and governance
- Dwell is measured per anonymous track within a single camera session and aggregated before reporting.
- No individual is identified and no profile is built across visits.
- Aggregate dwell series can be retained without retaining imagery.
- Where zones cover staff positions, employee monitoring obligations may apply.
Frequently asked questions
Does long dwell mean customers are interested?
Not necessarily. Long dwell at a counter may mean a slow service process rather than engagement, and a queue beside a display produces dwell unrelated to it. Dwell is a measurement of duration; interpreting it requires knowing what else is happening in that space.
Why report distributions instead of an average?
Because an average hides the difference between a hundred three-second passes and ten thirty-second stops. The median and upper percentiles usually describe behaviour more usefully, and the histogram makes the pattern visible.
Can you follow one person between zones?
Not on this site. Tracks are scoped to a camera session and aggregated. Cross-camera re-identification is not part of the published Ayonix video analytics capability set and is not offered here.
Keep reading
Related solutions and industries
Related solutions
-
Heatmap analytics
Visualise which areas of a floor attract the most activity, compare periods and test layout chan…
-
Queue management
Measure queue length and waiting time at checkouts, counters and gates, and warn supervisors bef…
-
Customer flow analytics
Combine directional counting, dwell and heatmaps to show how visitors move through a space, whic…
-
Dwell time alerting
Raise an event when a person or vehicle remains in a defined area longer than expected, using Ay…
Where it is used
-
Retail
Video analytics for stores that already have the cameras
-
Airports
Video analytics for airport terminals and airside boundaries
-
Shopping malls
Video analytics for shopping centre leasing and operations
-
Hospitality
Video analytics for hotel and venue public areas
- Author
- Gabriel Bamola, Chief Marketing Officer, Ayonix
- Technical review
- Dr Sadi Vural, Founder and Chief Executive Officer, Ayonix
- Published
- Last reviewed
Evaluate dwell time analytics on your own cameras
A controlled pilot establishes what this analytic actually does in your environment, against acceptance criteria we agree before it starts. Send a sample video first if you would rather see an assessment before committing to a pilot.