Agent activity
Checking for WebMCP support
Requests are only sent after you confirm them. How this works
security analytics
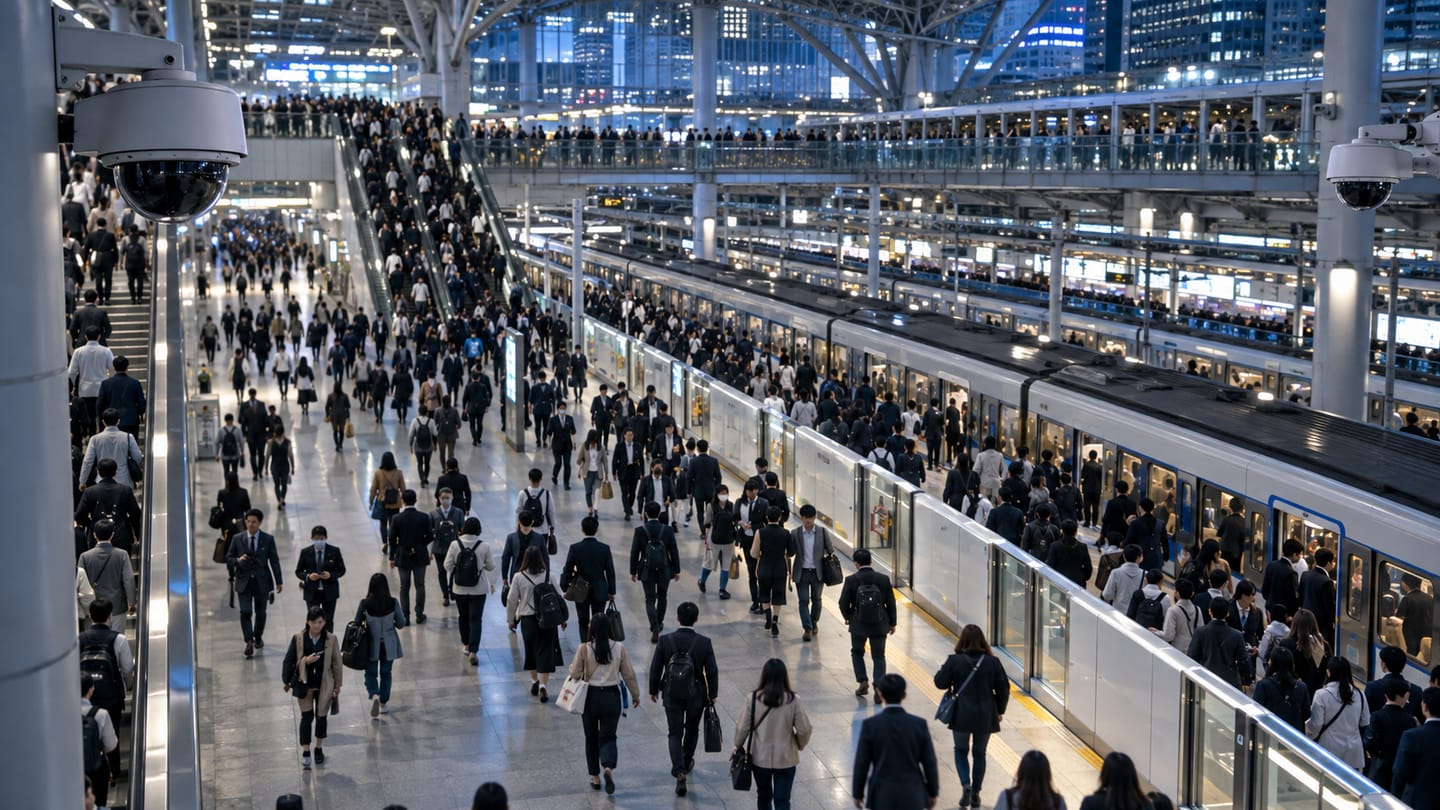
Crowd density monitoring for concourses, platforms and queues
In short
Crowd density monitoring estimates how densely people occupy defined regions of a camera view and trends that estimate over time. It gives control-room staff an early, consistent signal that a concourse or platform area is filling faster than usual, so crowd-management measures can start before conditions deteriorate.
Scope
What this analytic does, and what it does not
What it detects
- Estimated density band per defined region of the view
- Rate of change in density over a configured window
- Sustained density above a configured band
- Relative density between adjacent regions, showing where pressure is building
What it does not guarantee
- An exact number of people in a dense crowd
- Detection of individual behaviour within a crowd
- Prediction of a crowd incident
- Replacement of a crowd safety plan, stewarding or a certified crowd management process
The problem
What customers are actually dealing with
These are the situations that lead teams to look at this analytic in the first place.
- Control-room staff judge crowding by eye, and the judgement changes with who is on shift.
- By the time crowding is obvious on a monitor, the options for relieving it have already narrowed.
- There is no consistent record of how bad congestion was, which makes post-event review subjective.
- Counting individuals is not possible in a dense crowd, so counting-based tools stop being useful exactly when they are needed most.
How it works
Detection workflow
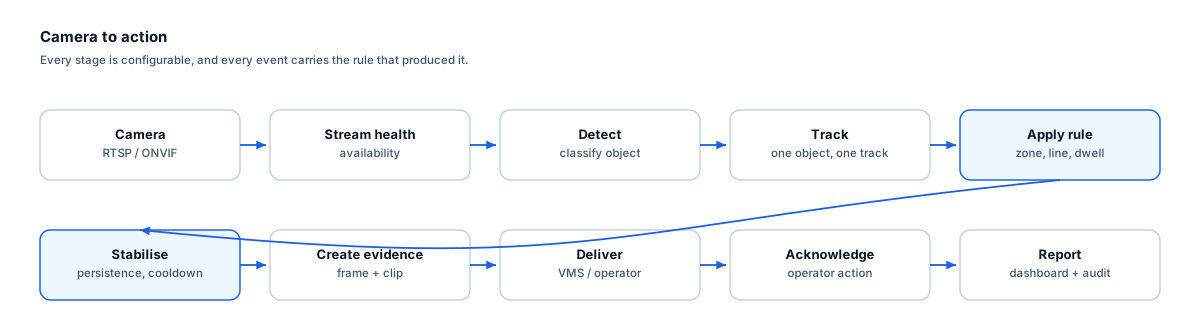
Every event carries the rule that produced it, so an operator can see why they were alerted.
- 1
Ingest
Concourse camera streams are read and monitored for availability.
- 2
Estimate density
Occupancy of each defined region is estimated as a density band rather than an exact count.
- 3
Smooth
Estimates are smoothed across a configurable window to suppress momentary fluctuation.
- 4
Evaluate thresholds
Sustained band and rate-of-change rules are evaluated per region.
- 5
Deliver
Warnings are routed to the control room with the live view and the trend for that region.
Configuration options
- Density regions drawn per camera, aligned to physically meaningful areas
- Density bands and the sustained duration required to raise each
- Smoothing window length
- Rate-of-change thresholds for a fast-fill warning
- Schedules matched to timetable or event patterns
- Alert routing and escalation per region
Alert quality
How irrelevant and duplicate alerts are reduced
No video analytic eliminates false alerts. These are the mechanisms that reduce them, and the residual rate is measured on your own cameras.
- Smoothing prevents a single crowded frame from raising a warning.
- A sustained-duration requirement separates a passing surge from genuine build-up.
- Region-level evaluation avoids trying to resolve individuals in a crowd, which is where counting approaches fail.
- Schedules align expectations with timetabled peaks so routine busy periods do not generate constant warnings.
- Density estimation in crowds is inherently approximate, and band thresholds must be calibrated on your own cameras.
Prerequisites
Camera requirements and environmental limits
Camera suitability decides more of the outcome than any software setting. These are assessed per camera before commitment.
Camera requirements
- An elevated view over the area of interest — a near-horizontal view cannot separate depth and will over-estimate density
- A field of view that covers a physically meaningful area rather than a fragment of it
- Consistent lighting across the region, avoiding a mix of bright daylight and deep shadow in one region
- Stable mounting so regions remain aligned with the physical space
- Adequate resolution across the far end of the region
Environmental limitations
- Density estimates are approximate and are reported as bands, not counts.
- Perspective means the far end of a region contains more people per pixel than the near end; regions must be drawn with this in mind.
- Umbrellas, large luggage and uniform crowds change appearance and affect estimation.
- A camera view that includes a large empty area will dilute the density figure for the region.
Delivery
Alerts, evidence and where they land
Event and evidence fields
- Region name and camera
- Density band at trigger and duration in band
- Rate of change over the window
- Adjacent region bands for context
- Timestamp with timezone
- Still frame and short clip
- Event identifier
VMS integration
Density warnings are most useful when they bring the relevant camera to the operator’s attention automatically, which maps to a VMS alarm or custom event. The density trend itself belongs on the control-room dashboard alongside the live view.
See compatibility states →Deployment options
- Edge processing at the station or venue so warnings survive a WAN interruption
- On-premise processing where concourse cameras already aggregate to a local VMS
- Multi-site deployment so a network control room sees comparable bands across stations
Measurement
Dashboard metrics and pilot acceptance criteria
Acceptance thresholds are agreed with you before the pilot starts. This site publishes no benchmark figures, because they do not transfer between sites.
Dashboard metrics
- Current density band per region
- Minutes per day in each band, per region
- Peak band and time of peak
- Rate-of-change events per day
- Regions most frequently in the upper band
- Camera availability per region
Measurable pilot criteria
- Band agreement with an independent manual assessment at sampled times
- Consistency of band reporting across comparable conditions on different days
- Warning latency from the onset of sustained crowding
- False warnings per day during normal timetabled peaks
- Behaviour during at least one genuine disruption event, where one occurs in the pilot window
Governance
Privacy and governance
- Density estimation is an aggregate measure and does not identify individuals.
- No biometric processing is performed by this analytic.
- Where density data is retained for planning, aggregate series can be kept without retaining imagery.
Frequently asked questions
Why bands instead of a person count?
In a dense crowd, individuals occlude each other and counting becomes unreliable precisely when the information matters most. Reporting a calibrated density band is more honest and more operationally useful than an exact-looking number that cannot be trusted.
Can it predict a crowd crush?
No. It reports current and recent density and how quickly it is changing. Prediction of crowd incidents is not claimed. The value is earlier, more consistent awareness so that documented crowd-management measures start sooner.
How are the bands calibrated?
During the pilot, reported bands are compared with independent assessments at sampled times on your own cameras, and thresholds are adjusted so that the upper band corresponds to the level your crowd-safety plan already treats as significant.
Keep reading
Related solutions and industries
Related solutions
-
Occupancy monitoring
Track how many people are inside a space using directional counting at entrances, with configura…
-
People counting
Count directional footfall across a virtual line using existing cameras, compare peak periods an…
-
Queue management
Measure queue length and waiting time at checkouts, counters and gates, and warn supervisors bef…
-
Person detection
Classify people in a camera view as the foundation for counting, zone rules and occupancy, with …
Where it is used
-
Railway and metro
Video analytics for stations, platforms and concourses
-
Stadiums and events
Video analytics for stadium gates, concourses and event spaces
-
Airports
Video analytics for airport terminals and airside boundaries
-
Shopping malls
Video analytics for shopping centre leasing and operations
- Author
- Gabriel Bamola, Chief Marketing Officer, Ayonix
- Technical review
- Dr Sadi Vural, Founder and Chief Executive Officer, Ayonix
- Published
- Last reviewed
Evaluate crowd density monitoring on your own cameras
A controlled pilot establishes what this analytic actually does in your environment, against acceptance criteria we agree before it starts. Send a sample video first if you would rather see an assessment before committing to a pilot.